Introduction
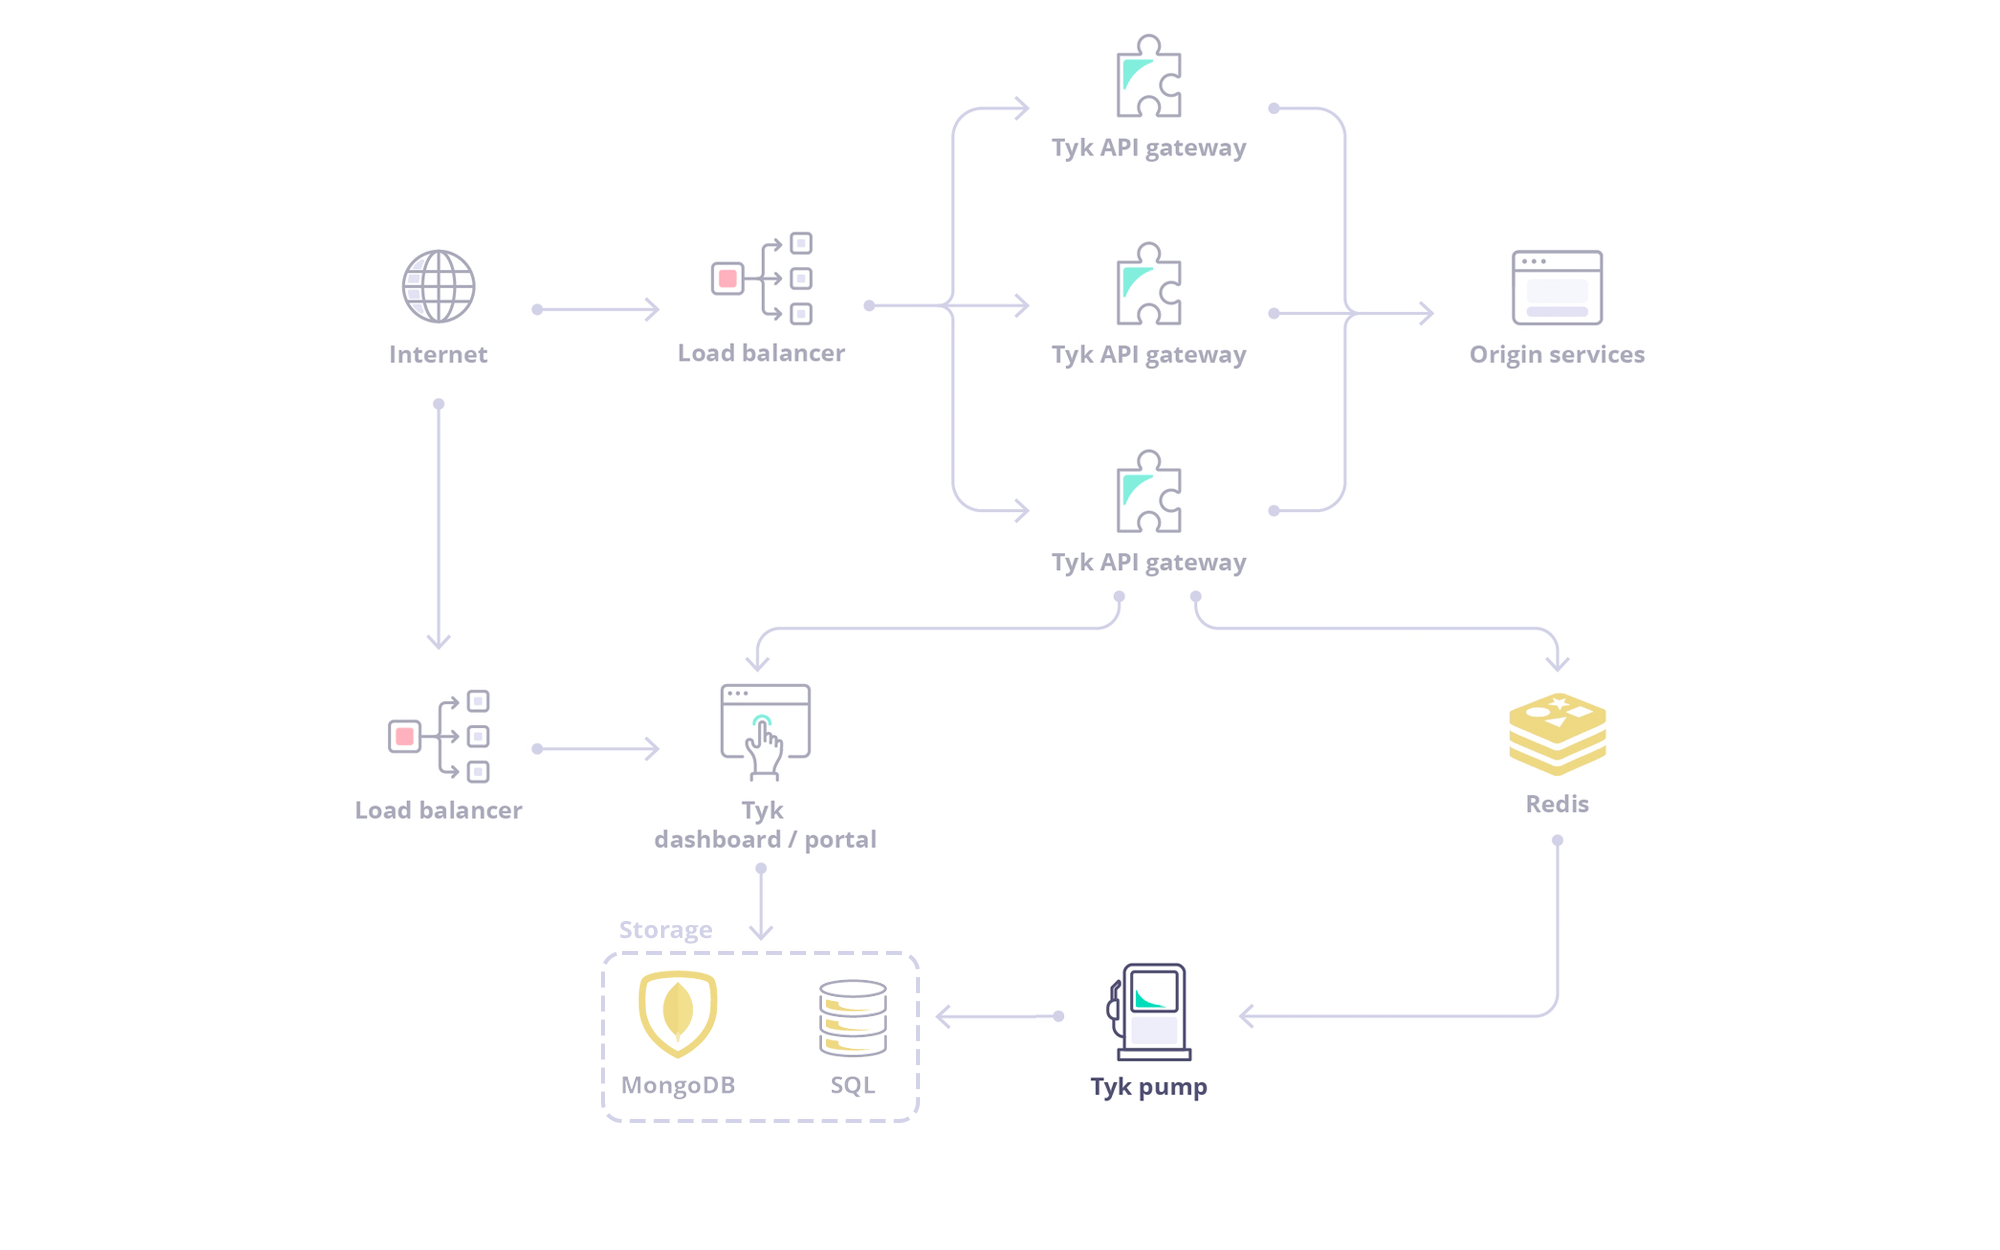
Traffic analytics are captured by the Gateway nodes and then temporarily stored in Redis. The Tyk Pump is responsible for moving those analytics into a persistent data store, such as MongoDB, where the traffic can be analyzed.What is the Tyk Pump?
The Tyk Pump is our open source analytics purger that moves the data generated by your Tyk nodes to any back-end. It is primarily used to display your analytics data in the Tyk Dashboard.The Tyk Pump is not currently configurable in our Tyk Cloud solution.
Tyk Pump Data Flow
Here’s the architecture depending on your deployment model:- Enterprise
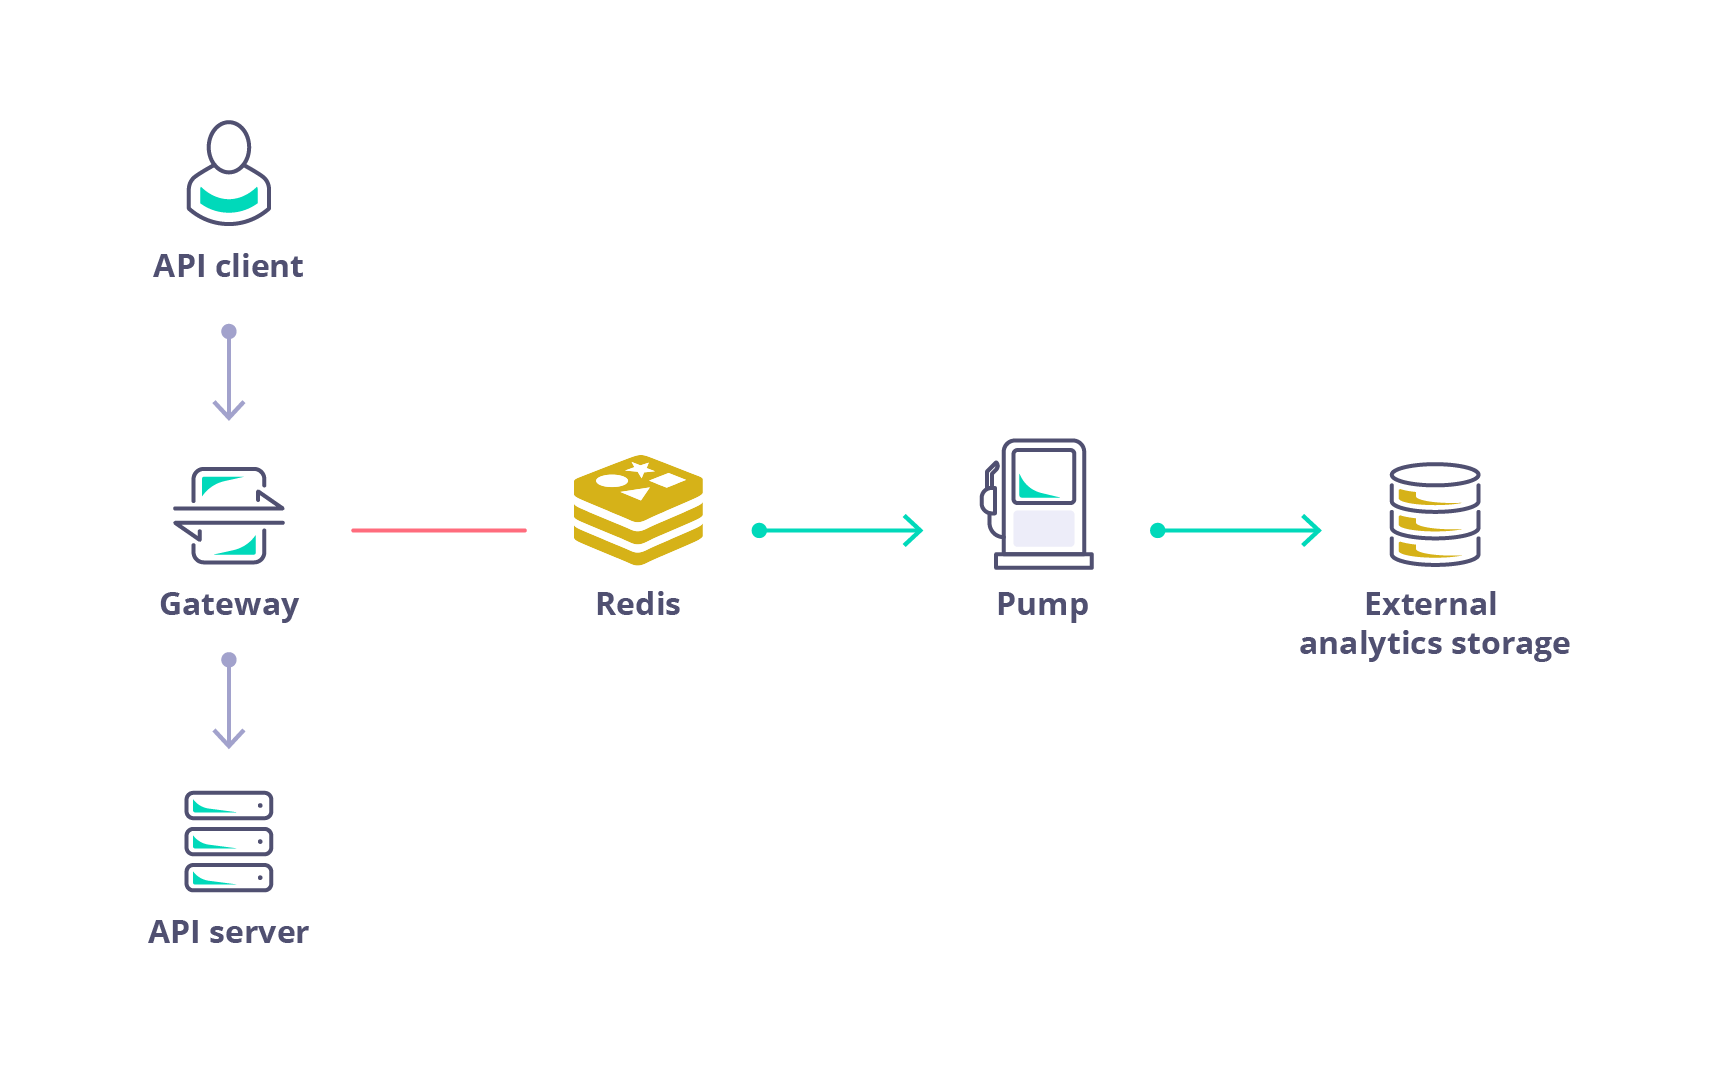
- Open Source
 |
|---|
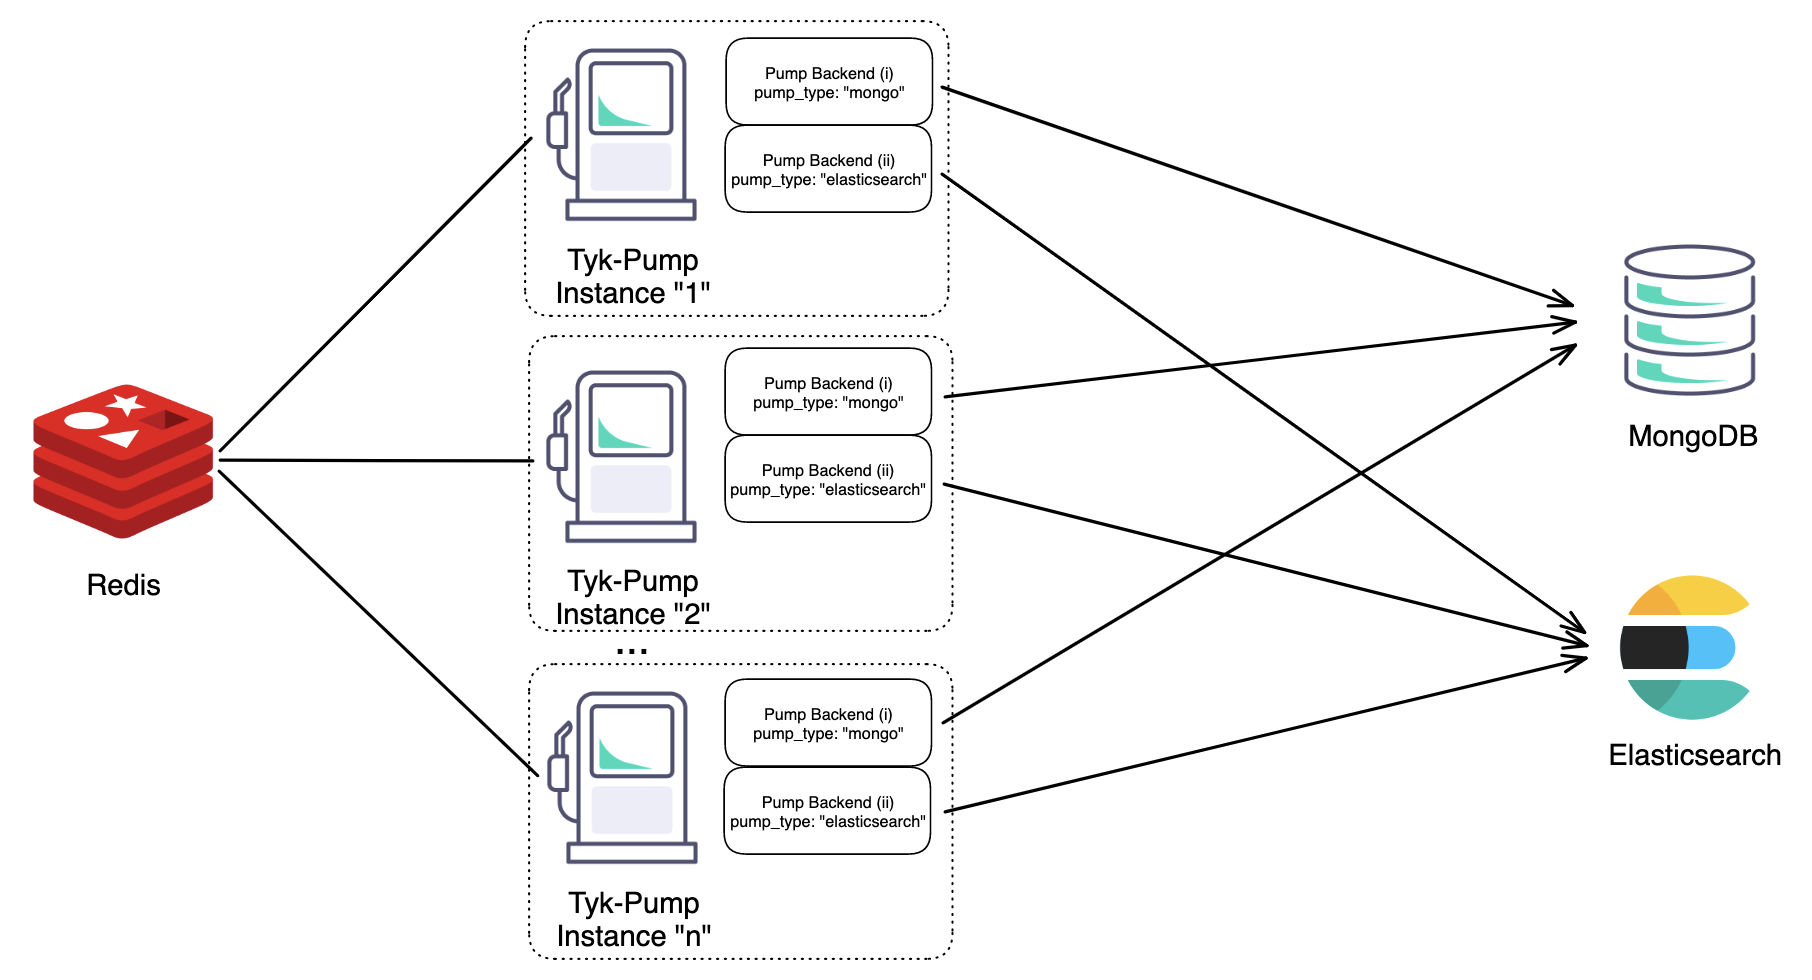
| Figure 1: An architecture diagram illustrating horizontal scaling of “n” Instances of Tyk-Pump each with two different backends. |
Other Supported Backend Services
We list our supported backends here.Configuring your Tyk Pump
See Tyk Pump Configuration for more details on setting up your Tyk Pump. Tyk Pump can be horizontally scaled without causing duplicate data, please see the following Table for the supported permutations of Tyk Pump scaling.| Supported | Summary |
|---|---|
| ✅ | Single Pump Instance, Single Backend |
| ✅ | Single Pump Instance, Multiple Backend(s) |
| ✅ | Multiple Pump Instances, Same Backend(s) |
| ❌ | Multiple Pump Instances, Different Backend(s) |
Getting Started
Tyk Pump Configuration
The Tyk Pump is our Open Source analytics purger that moves the data generated by your Tyk nodes to any back-end. By moving the analytics into your supported database, it allows the Tyk Dashboard to display traffic analytics across all your Tyk Gateways.Tyk Dashboard
MongoDB
The Tyk Dashboard uses themongo-pump-aggregate collection to display analytics. This is different than the standard mongo pump plugin that will store individual analytic items into MongoDB. The aggregate functionality was built to be fast, as querying raw analytics is expensive in large data sets. See Pump Dashboard Config for more details.
SQL
Tyk no longer supports SQLite as of Tyk 5.7.0. To avoid disruption, please transition to PostgreSQL, MongoDB, or one of the listed compatible alternatives.
- PostgreSQL
- SQLite
tyk-analytics.conf) there is now a storage section.
Field description
main- Main storage (APIs, Policies, Users, User Groups, etc.)analytics- Analytics storage (used for display all the charts and for all analytics screens)logs- Logs storage (log browser page)uptime- uptime tests analytics data
Common settings
For everystorage section, you must populate the following fields:
typeuse this field to define your SQL platform (currently SQLite or PostgreSQL are supported)connection_stringthe specific connection settings for your platform
sql name and database specific configuration options.
####### SQL example
Capping analytics data
Tyk Gateways can generate a lot of analytics data. Be sure to read about capping your Dashboard analyticsOmitting the configuration file
From Tyk Pump 1.5.1+, you can configure an environment variable to omit the configuration file with theTYK_PMP_OMITCONFIGFILE variable.
This is specially useful when using Docker, since by default, the Tyk Pump has a default configuration file with pre-loaded pumps.
Sharding analytics to different data sinks
In a multi-organization deployment, each organization, team, or environment might have their preferred analytics tooling. This capability allows the Tyk Pump to send analytics for different organizations or various APIs to different destinations. E.g. Org A can send their analytics to MongoDB + DataDog while Org B can send their analytics to DataDog + expose the Prometheus metrics endpoint.Configuring the sharded analytics
You can achieve the sharding by setting both an t and a , meaning that some data sinks can receive information for all orgs, whereas other data sinks will not receive certain organization’s analytics if it was block listed. This feature makes use of the field calledfilters, which can be defined per pump. This is its structure:
api_idsandorg_idsworks as allow list (APIs and orgs where we want to send the analytic records).skip_api_idsandskip_org_idsworks as block list (APIs and orgs where we want to filter out and not send their the analytic records).
org1 or org2 will go to the csv backend and everything but analytics records from api_id_1 to elasticsearch.
Setup Dashboard Analytics
To enable Dashboard Analytics, you would need to configure Tyk Pump to send analytic data to the Dashboard storage MongoDB / SQL. These are the different pumps that handle different kinds of analytic data.| Analytics | Activities Graph | Log Browser | Uptime Analytics |
|---|---|---|---|
| Mongo (Multi organization) | Mongo Aggregate Pump | Mongo Selective Pump | Uptime Pump |
| Mongo (Single organization) | Mongo Aggregate Pump | Mongo Pump | Uptime Pump |
| SQL | SQL Aggregate Pump | SQL Pump | Uptime Pump |
MongoDB
Mongo Pump
mongo Pump simply saves all individual requests across every organization to a collection called tyk_analytics. Each request will be stored as a single document.
Pump Config
Capping
This collection should be capped due to the number of individual documents. This is especially important if thedetailed_recording in the Gateway is turned on which means that the Gateway records the full payload of the request and response.
Omitting Indexes
From Pump 1.6+, the Mongo Pumps indexes default behavior is changed and the new configuration optionomit_index_creation is available. This option is applicable to the following Pumps: Mongo Pump,Mongo Aggregate Pump and Mongo Selective Pump.
The behavior now depends upon the value of ‘omit_index_creation’ and the Pump in use, as follows:
- If
omit_index_creationis set totrue, tyk-pump will not create any indexes (for Mongo pumps). - If
omit_index_creationis set tofalse(default) and you are usingDocumentDB, tyk-pump will create the Mongo indexes. - If
omit_index_creationis set tofalse(default) and you are usingMongoDB, the behavior of tyk-pump depends upon whether the collection already exists:- If the collection exists, tyk-pump will not create the indexes again.
- If the collection does not already exist, tyk-pump will create the indexes.
Dashboard Setting
In API Usage Data > Log Browser screen you will see all the individual requests that the Gateway has recorded and saved intyk_analytics collection using the mongo pump.
Because you have the option to store and display analytics of every organization or separately per organization, you need to configure the Tyk Dashboard with the matching setting according to the way you set the pump to store the data in MongoDB.
The field use_sharded_analytics controls the collection that the dashboard will query.
- If
use_sharded_analytics: false- the dashboard will query the collectiontyk_analyticsthat mongo pump populated - If
use_sharded_analytics: true- the dashboard will query the collection thatmongo-pump-selectivepump populated
Mongo Aggregate Pump
mongo-pump-aggregate pump stores data in a collection called **z_tyk_analyticz_aggregate_{ORG ID}**.
Pump Config
use_mixed_collection: true- will store analytics to both your organization defined collectionsz_tyk_analyticz_aggregate_{ORG ID}and your org-lesstyk_analytics_aggregatescollection.use_mixed_collection: false- your pump will only store analytics to your org defined collection.
tyk_analytics_aggregates collection is used to query analytics across your whole Tyk setup. This can be used, for example, by a superuser role that is not attached to an organization. When set to true, you also need to set use_sharded_analytics to true in your Dashboard config.
Dashboard Setting
This pump supplies the data for the following sub categoriesAPI Usage Data:
- Activity by API screen
- Activity by Key screen
- Errors screen
- The enable_aggregate_lookups: true field must be set in the Dashboard configuration file, in order for the Dashboard to query and display the aggregated data that
mongo-pump-aggregatesaved to MongoDB.
Capping
As a minimal number of documents get stored, you don’t need to worry about capping this. The documents contain aggregate info across an individual API, such as total requests, errors, tags and more. ####### High Traffic Environment Settings If you have a high traffic environment, and you want to ignore aggregations to avoid Mongo overloading and/or reduce aggregation documents size, you can do it using theignore_aggregations configuration option. The possible values are:
- APIID
- Errors
- Versions
- APIKeys
- OauthIDs
- Geo
- Tags
- Endpoints
- KeyEndpoint
- OauthEndpoint
- ApiEndpoint
request_id or timestamp), this collection can grow a lot since aggregation of unique values simply creates a record/document for every single value with a counter of 1. To mitigate this, avoid tagging unique headers as the first option. If you can’t change the API definition quickly, you can add the tag to the ignore list "ignore_aggregations": ["request_id"]. This ensures that Tyk pump does not aggregate per request_id.Also, if you are not sure what’s causing the growth of the collection, you can also set time capping on these collections and monitor them.
Mongo Selective Pump
mongo-pump-selective pump stores individual requests per organization in collections called z_tyk_analyticz_{ORG ID}.
Similar to the regular mongo pump, Each request will be stored as a single document.
Pump Config
This collection should be capped due to the number of individual documents.Capping
This collection should be capped due to the number of individual documents.Dashboard Setting
As with the regular analytics, if you are using the Selective pump, you need to setuse_sharded_keys: true in the dashboard config file so it will query z_tyk_analyticz_{ORG ID} collections to populate the Log Browser.
Uptime Tests Analytics
Pump Configuration
Tyk Dashboard Configuration
Tyk Gateway Setting
To enable Uptime Pump, modify gateway configuration enable_uptime_analytics to true.SQL
When using one of our supported SQL platforms, Tyk offers 3 types of SQL pumps:- Aggregated Analytics:
sql_aggregate - Raw Logs Analytics:
sql - Uptime Tests Analytics
- Sharding raw logs
- Sharding aggregated analytics
- Sharding uptime tests
SQL Pump
While aggregated analytics offer a decent amount of details, there are use cases when you’d like to have access to all request details in your analytics. For that you can generate analytics based on raw logs. This is especially helpful when, once you have all the analytics generated based on raw logs stored in your SQL database, you can then build your own custom metrics, charts etc. outside of your Tyk Dashboard, which may bring more value to your product. The pump needed for storing log data in the database is very similar to other pumps as well as the storage setting in the Tyk Dashboard config. It just requires the SQL name and database-specific configuration options.SQL Pump Configuration
For storing logs into thetyk_analytics database table.
type - The supported types are sqlite and postgres.
connection_string - Specifies the connection string to the database. For example, for sqlite it will be the path/name of the database, and for postgres, specifying the host, port, user, password, and dbname.
log_level - Specifies the SQL log verbosity. The possible values are: info,error and warning. By default, the value is silent, which means that it won’t log any SQL query.
table_sharding - Specifies if all the analytics records are going to be stored in one table or in multiple tables (one per day). By default, it is set to false.
If table_sharding is false, all the records are going to be stored in the tyk_analytics table. If set to true, daily records are stored in a tyk_analytics_YYYYMMDD date formatted table.
Dashboard Setting
In the API Usage Data > Log Browser screen you will see all the individual requests that the Gateway has recorded and saved intyk_analytics collection using the sql pump.
Make sure you have configured the dashboard with your SQL database connection settings:
SQL Aggregate Pump
This is the default option offered by Tyk, because it is configured to store the most important analytics details which will satisfy the needs of most of our clients. This allows your system to save database space and reporting is faster, consuming fewer resources.SQL Aggregate Pump Configuration
For storing logs into thetyk_aggregated database table.
type - The supported types are sqlite and postgres.
connection_string - Specifies the connection string to the database. For example, for sqlite it will be the path/name of the database, and for postgres, specifying the host, port, user, password, and dbname.
log_level - Specifies the SQL log verbosity. The possible values are: info, error, and warning. By default, the value is silent, which means that it won’t log any SQL query.
track_all_paths - Specifies if it should store aggregated data for all the endpoints. By default, it is set to false, which means that it only stores aggregated data for tracked endpoints.
ignore_tag_prefix_list - Specifies prefixes of tags that should be ignored.
table_sharding - Specifies if all the analytics records are going to be stored in one table or in multiple tables (one per day). By default, it is set to false.
If table_sharding is false, all the records are going to be stored in the tyk_aggregated table. If set to true, daily records are stored in a tyk_aggregated_YYYYMMDD date formatted table.
Dashboard Setting
This pump supplies the data for the following sub categoriesAPI Usage Data:
- Activity by API screen
- Activity by Key screen
- Errors screen
-
The enable_aggregate_lookups: true field must be set in the Dashboard configuration file, in order for the Dashboard to query and display the aggregated data that
sql-aggregatesaved to the database. - Make sure you have configured the dashboard with your SQL database connection settings:
SQL Uptime Pump
In anuptime_pump_config section, you can configure a SQL uptime pump. To do that, you need to add the field uptime_type with sql value.
type - The supported types are sqlite and postgres.
connection_string - Specifies the connection string to the database. For example, for sqlite it will be the path/name of the database, and for postgres, specifying the host, port, user, password, and dbname.
table_sharding - Specifies if all the analytics records will be stored in one table or multiple tables (one per day). By default, it is set to false.
If table_sharding is false, all the records will be stored in the tyk_analytics table. If set to true, daily records are stored in a tyk_analytics_YYYYMMDD date formatted table.
Tyk Dashboard Configuration
You need to setenable_aggregate_lookups to false
Then add your SQL database connection settings:
Uptime Tests Analytics
Tyk Pump Configuration
For storing logs into thetyk_aggregated database table.
Tyk Dashboard Configuration
Tyk Gateway Setting
To enable Uptime Pump, modify gateway configuration enable_uptime_analytics to true.Sharding
In a production environment, we recommend the following setup: By default, all logs/analytics are stored in one database table, making it hard and less performant to execute CRUD operations on the dataset when it grows significantly. To improve the data maintenance processes, as querying or removing data from one single table is slow, we have added a new option (table_sharding), so that the data can be stored daily (one table of data per day), which will automatically make querying or removing sets of data easier, whether dropping tables for removing logs/analytics, or reading multiple tables based on the selected period.
Tyk Pump Configuration
Tyk Dashboard Configuration
Graph Pump setup
MongoDB
Starting with version1.7.0 of Tyk Pump and version 4.3.0 of Tyk Gateway it is possible to configure Graph MongoDB Pump. Once configured, the pump enables support for Graphql-specific metrics. The Graphql-specific metrics currently supported include (more to be added in future versions ):
- Types Requested.
- Fields requested for each type.
- Error Information (not limited to HTTP status codes).
Setting up Graph MongoDB Pump
-
Set
enable_analyticstotruein yourtyk.conf. -
Enable Detailed recording by setting
enable_detailed_recordingin yourtyk.conftotrue. This is needed so that the GraphQL information can be parsed from the request body and response.This will enable detailed recording globally, across all APIs. This means that the behavior of individual APIs that have this configuration parameter set will be overridden. The Gateway must be restarted after updating this configuration parameter. -
Set up your Mongo
collection_name. -
Add your Graph MongoDB Pump configuration to the list of pumps in your
pump.conf(pump configuration file).
Current limitations
The Graph MongoDB Pump is being improved upon regularly and as such there are a few things to note about the Graph MongoDB Pump current behavior:- Size of your records - due to the detailed recording being needed for this Pump’s to function correctly, it is important to note that your records and consequently, your MongoDB storage could increase in size rather quickly.
- Subgraph requests are not recorded - Requests to tyk-controlled subgraphs from supergraphs in federation setting are currently not recorded by the Graph MongoDB Pump, just the supergraph requests are handled by the Graph MongoDB Pump.
- UDG requests are recorded but subsequent requests to data sources are currently ignored.
- Currently, Graph MongoDB Pump data can not be used in Tyk Dashboard yet, the data is only stored for recording purposes at the moment and can be exported to external tools for further analysis.
SQL
Starting with Version1.8.0 of Tyk Pump and version 5.0.0 of the Tyk Gateway; It is possible to export GraphQL analytics to an SQL database.
Setting up Graph SQL Pump
With the Graph SQL pump currently includes information (per request) like:- Types Requested
- Fields requested for each type
- Error Information
- Root Operations Requested.
-
Set
enable_anayticstotruein yourtyk.conf. -
Enable Detailed recording by setting
enable_detailed_recordingin yourtyk.conftotrue. This is needed so that the GraphQL information can be parsed from the request body and response.This will enable detailed recording globally, across all APIs. This means that the behavior of individual APIs that have this configuration parameter set will be overridden. The Gateway must be restarted after updating this configuration parameter. -
Configure your
pump.confusing this sample configuration:
postgres, sqlite and mysql databases. The table_name refers to the table that will be created in the case of unsharded setups, and the prefix that will be used for sharded setups
e.g tyk_analytics_graph_20230327.
The Graph SQL pump currently has the same limitations as the Graph Mongo Pump.
Setting up Graph SQL Aggregate Pump
Thesql-graph-aggregate can be configured similar to the Graph SQL pump:
External Data Stores
The Tyk Pump component takes all of the analytics in Tyk and moves the data from the Gateway into your Dashboard. It is possible to set it up to send the analytics data it finds to other data stores. Currently we support the following:- MongoDB or SQL (Used by the Tyk Dashboard)
- CSV
- Elasticsearch (2.0 - 7.x)
- Graylog
- Resurface.io
- InfluxDB
- Moesif
- Splunk
- StatsD
- DogStatsD
- Hybrid (Tyk RPC)
- Prometheus
- Logz.io
- Kafka
- Syslog (FluentD)
CSV
Tyk Pump can be configured to create or modify a CSV file to track API Analytics.JSON / Conf file
Add the following configuration fields to the pumps section within yourpump.conf file:
Environment variables
Datadog
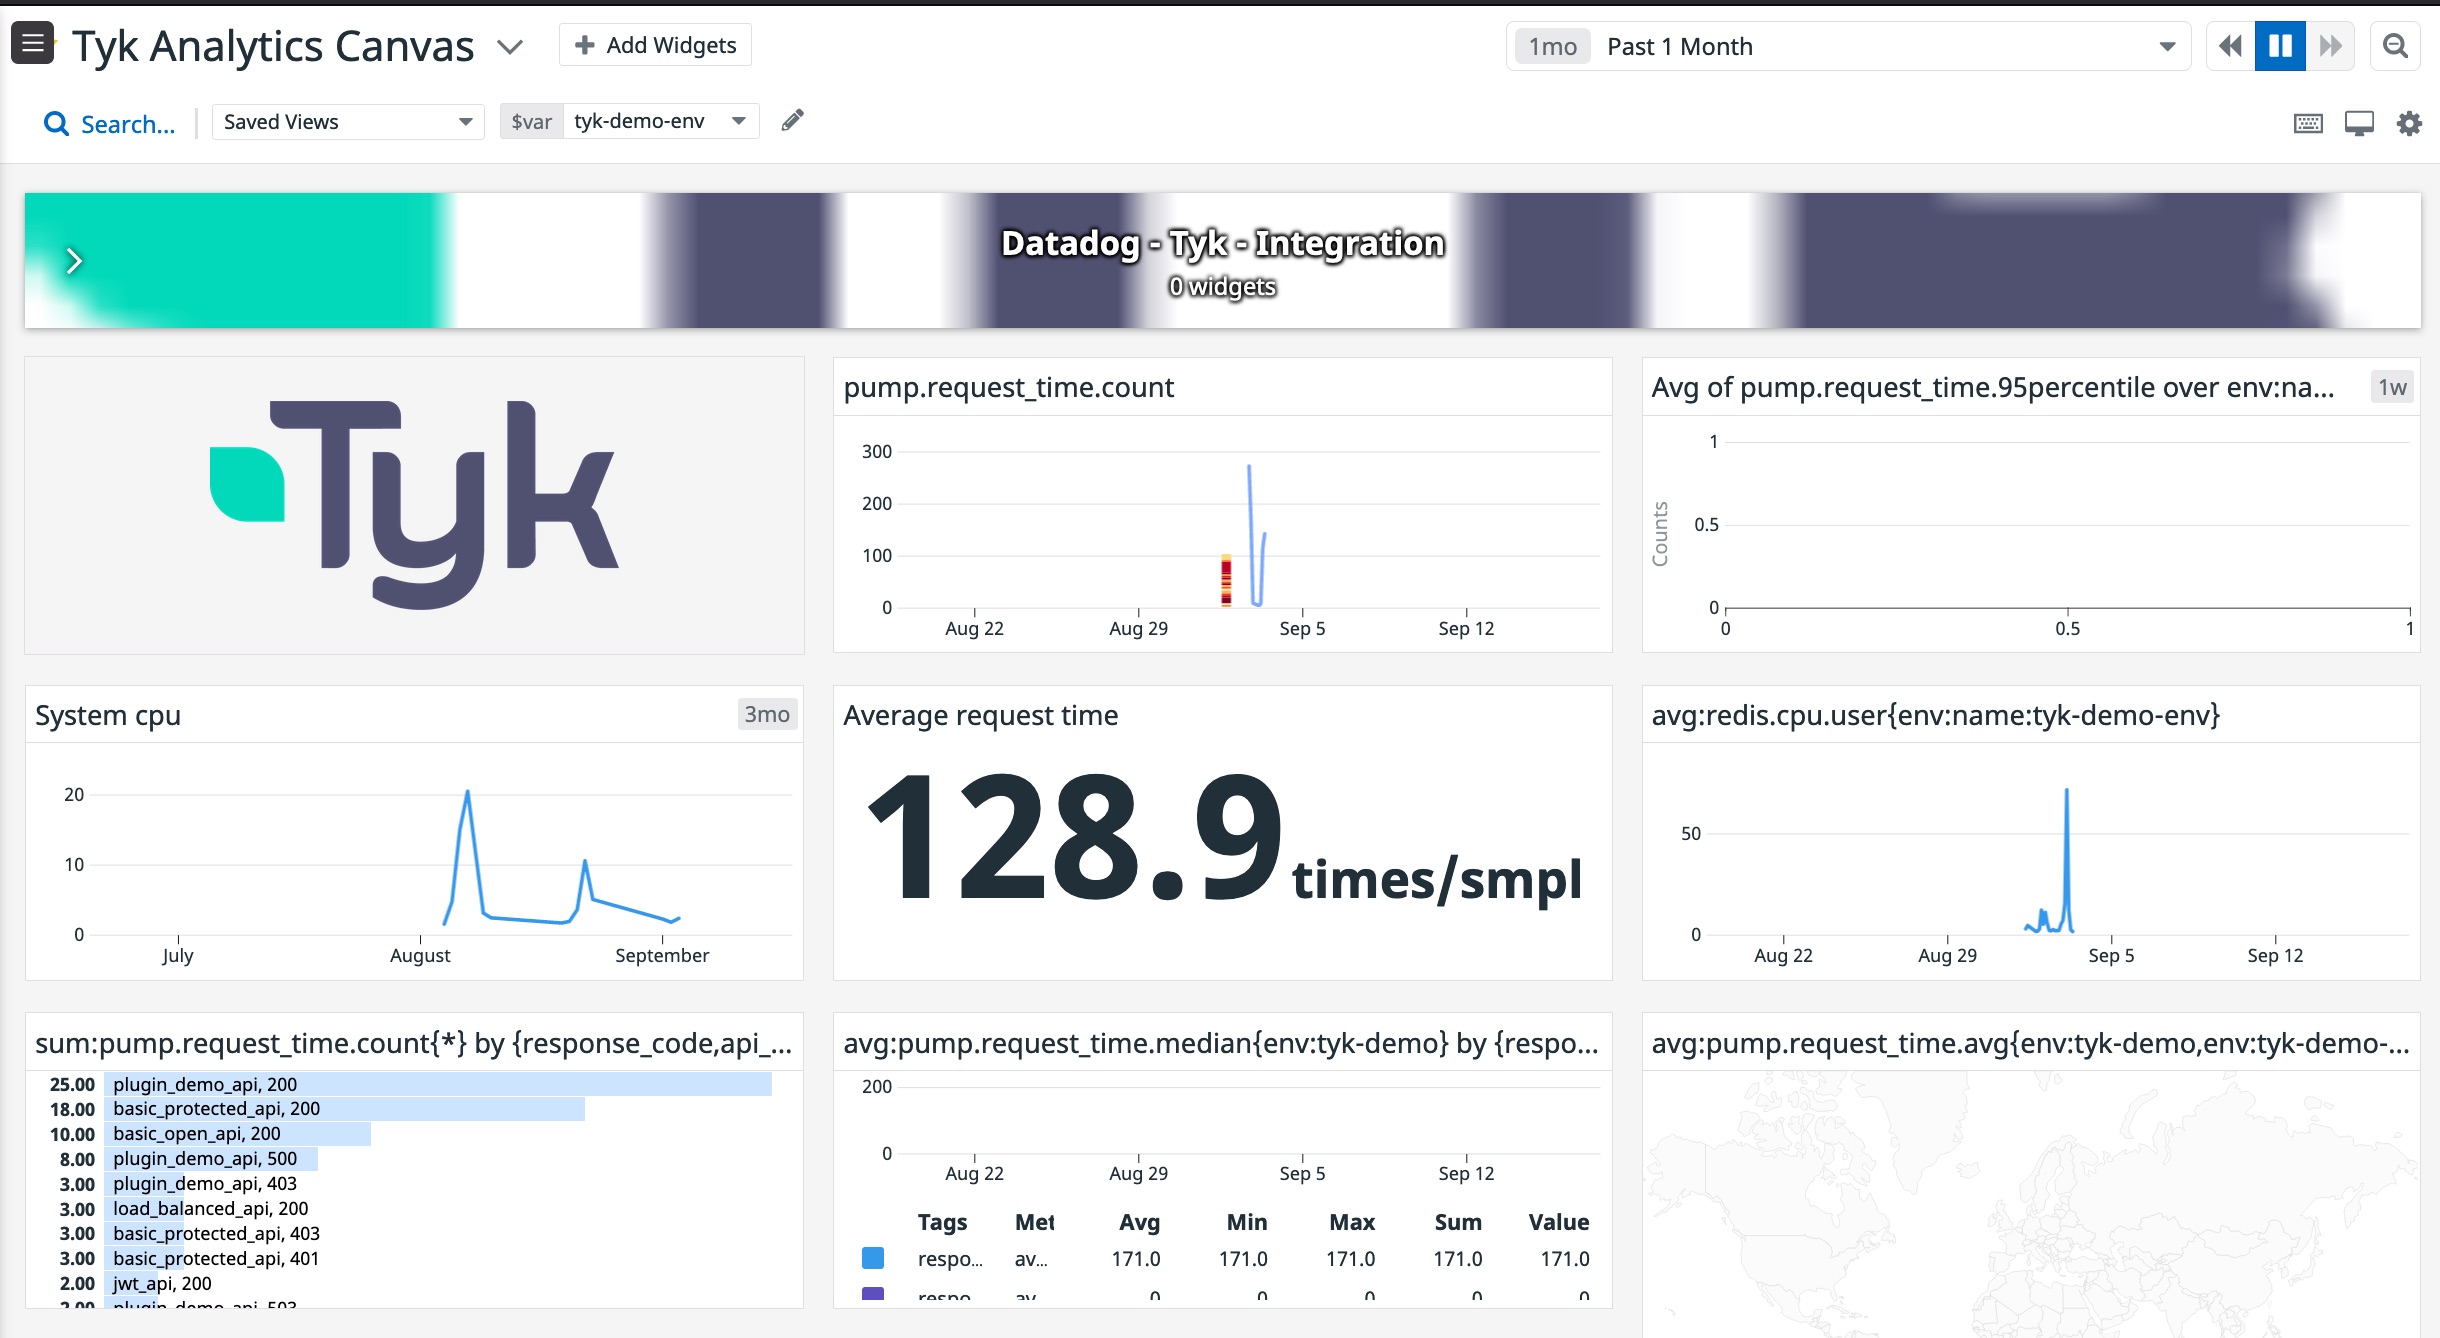
The Tyk Pump can be configured to send your API traffic analytics to Datadog with which you can build a dashboards with various metrics based on your API traffic in Tyk.Datadog dashboard example
We ceated a defaulkt Tyk dashboard canvat to give our users an easier starting point. You can find it in Datadog portal, under theDashboards --> lists section, (https://app.datadoghq.com/dashboard/lists)[https://app.datadoghq.com/dashboard/lists], and it is called Tyk Analytics Canvas. To use this dashboard you will need to make sure that your datadog agent deployment has the following tag env:tyk-demo-env and that your Tyk Pump configuration has dogstatsd.meta.namespace set to pump. You can also import it from Datadog official GH repo and change those values in the dashboard itself to visualize your analytics data as it flows into Datadog.
Prerequisites
- A working Datadog agent installed on your Environment. See the Datadog Tyk integration docs for more information.
- Either a Tyk Pro install or Tyk OSS Gateway install along with a Tyk Pump install.
How it works
When running the Datadog Agent, DogstatsD gets the request_time metric from your Tyk Pump in real time, per request, so you can understand the usage of your APIs and get the flexibility of aggregating by various parameters such as date, version, returned code, method etc.Tyk Pump configuration
Below is a sample DogstatD section from a Tykpump.conf file
Field descriptions
address: address of the datadog agent including host & portnamespace: prefix for your metrics to datadogasync_uds: Enable async UDS over UDPasync_uds_write_timeout_seconds: Integer write timeout in seconds ifasync_uds: truebuffered: Enable buffering of messagesbuffered_max_messages: Max messages in single datagram ifbuffered: true. Default 16sample_rate: default 1 which equates to 100% of requests. To sample at 50%, set to 0.5tags: List of tags to be added to the metric. The possible options are listed in the below example
pathmethodresponse_codeapi_versionapi_nameapi_idorg_idtrackedoauth_id
path tag.
On startup, you should see the loaded configs when initialising the DogstatsD pump
Elasticsearch
Elasticsearch is a highly scalable and distributed search engine that is designed to handle large amounts of data.JSON / Conf
Add the following configuration fields to the pumps section within yourpump.conf file:
Configuration fields
index_name: The name of the index that all the analytics data will be placed in. Defaults totyk_analyticselasticsearch_url: If sniffing is disabled, the URL that all data will be sent to. Defaults tohttp://localhost:9200enable_sniffing: If sniffing is enabled, theelasticsearch_urlwill be used to make a request to get a list of all the nodes in the cluster, the returned addresses will then be used. Defaults tofalsedocument_type: The type of the document that is created in Elasticsearch. Defaults totyk_analyticsrolling_index: Appends the date to the end of the index name, so each days data is split into a different index name. For example,tyk_analytics-2016.02.28. Defaults tofalse.extended_stats: If set to true will include the following additional fields:Raw Request,Raw ResponseandUser Agent.version: Specifies the ES version. Use3for ES 3.X,5for ES 5.X,6for ES 6.X,7for ES 7.X . Defaults to3.disable_bulk: Disable batch writing. Defaults tofalse.bulk_config: Batch writing trigger configuration. Each option is an OR with each other:workers: Number of workers. Defaults to1.flush_interval: Specifies the time in seconds to flush the data and send it to ES. Default is disabled.bulk_actions: Specifies the number of requests needed to flush the data and send it to ES. Defaults to 1000 requests. If it is needed, can be disabled with-1.bulk_size: Specifies the size (in bytes) needed to flush the data and send it to ES. Defaults to 5MB. Can be disabled with-1.
Environment variables
Moesif
This is a step by step guide to setting up Moesif API Analytics and Monetization platform to understand customer API usage and setup usage-based billing. We also have a blog post which highlights how Tyk and Moesif work together. The assumptions are that you have Docker installed and Tyk Self-Managed already running. See the Tyk Pump Configuration for more details.Overview
With the Moesif Tyk plugin, your API logs are sent to Moesif asynchronously to provide analytics on customer API usage along with your API payloads like JSON and XML. This plugin also enables you to monetize your API with billing meters and provide a self-service onboarding experience. Moesif also collects information such as the authenticated user (AliasId or OAuthId) to identify customers using your API. An overview on how Moesif and Tyk works together is available here.Steps for Configuration
- Get a Moesif Application Id Go to www.moesif.com and sign up for a free account. Application Ids are write-only API keys specific to an application in Moesif such as “Development” or “Production”. You can always create more applications in Moesif.
- Enable Moesif backend in Tyk Pump Add Moesif as an analytics backend along with your Moesif Application Id you obtained in the last step to your Tyk Pump Configuration
- Ensure analytics is enabled
This will enable detailed recording globally, across all APIs. This means that the behavior of individual APIs that have this configuration parameter set will be overridden. The Gateway must be restarted after updating this configuration parameter.
- Restart Tyk Pump to pickup the Moesif config
$ docker restart tyk-pump
- PROFIT!
 The Moesif Tyk integration automatically maps a Tyk Token Alias to a user id in Moesif. With a Moesif SDK, you can store additional customer demographics to break down API usage by customer email, company industry, and more.
Configuration options
The Tyk Pump for Moesif has a few configuration options that can be set in yourpump.env:
| Parameter | Required | Description | Environment Variable |
|---|---|---|---|
| application_id | required | Moesif Application Id. Multiple Tyk api_id’s will be logged under the same app id. | TYK_PMP_PUMPS_MOESIF_META_APPLICATIONID |
| request_header_masks | optional | Mask a specific request header field. Type: String Array [] string | TYK_PMP_PUMPS_MOESIF_META_REQUESTHEADERMASKS |
| request_body_masks | optional | Mask a specific - request body field. Type: String Array [] string | TYK_PMP_PUMPS_MOESIF_META_REQUESTBODYMASKS |
| response_header_masks | optional | Mask a specific response header field. Type: String Array [] string | TYK_PMP_PUMPS_MOESIF_META_RESPONSEHEADERMASKS |
| response_body_masks | optional | Mask a specific response body field. Type: String Array [] string | TYK_PMP_PUMPS_MOESIF_META_RESPONSEBODYMASKS |
| disable_capture_request_body | optional | Disable logging of request body. Type: Boolean. Default value is false. | TYK_PMP_PUMPS_MOESIF_META_DISABLECAPTUREREQUESTBODY |
| disable_capture_response_body | optional | Disable logging of response body. Type: Boolean. Default value is false. | TYK_PMP_PUMPS_MOESIF_META_DISABLECAPTURERESPONSEBODY |
| user_id_header | optional | Field name to identify User from a request or response header. Type: String. Default maps to the token alias | TYK_PMP_PUMPS_MOESIF_META_USERIDHEADER |
| company_id_header | optional | Field name to identify Company (Account) from a request or response header. Type: String | TYK_PMP_PUMPS_MOESIF_META_COMPANYIDHEADER |
Identifying users
By default, the plugin will collect the authenticated user (AliasId or OAuthId) to identify the customer. This can be overridden by setting theuser_id_header to a header that contains your API user/consumer id such as X-Consumer-Id. You can also set the company_id_header which contains the company to link the user to. See Moesif docs on identifying customers
Splunk
This is a step by step guide to setting Splunk to receive logs from the Tyk Pump. The assumptions are that you have Docker installed and Tyk Pro Self-Managed already running.Steps for Configuration
-
Run Splunk using Docker
Assuming you have Docker installed locally, run the following from a terminal:
-
Setup a collector in Splunk
A) Visit http://localhost:8000 and log into the Splunk Dashboard using the username
adminand the password we set in the Docker run command,mypasswordB) Create a new Data input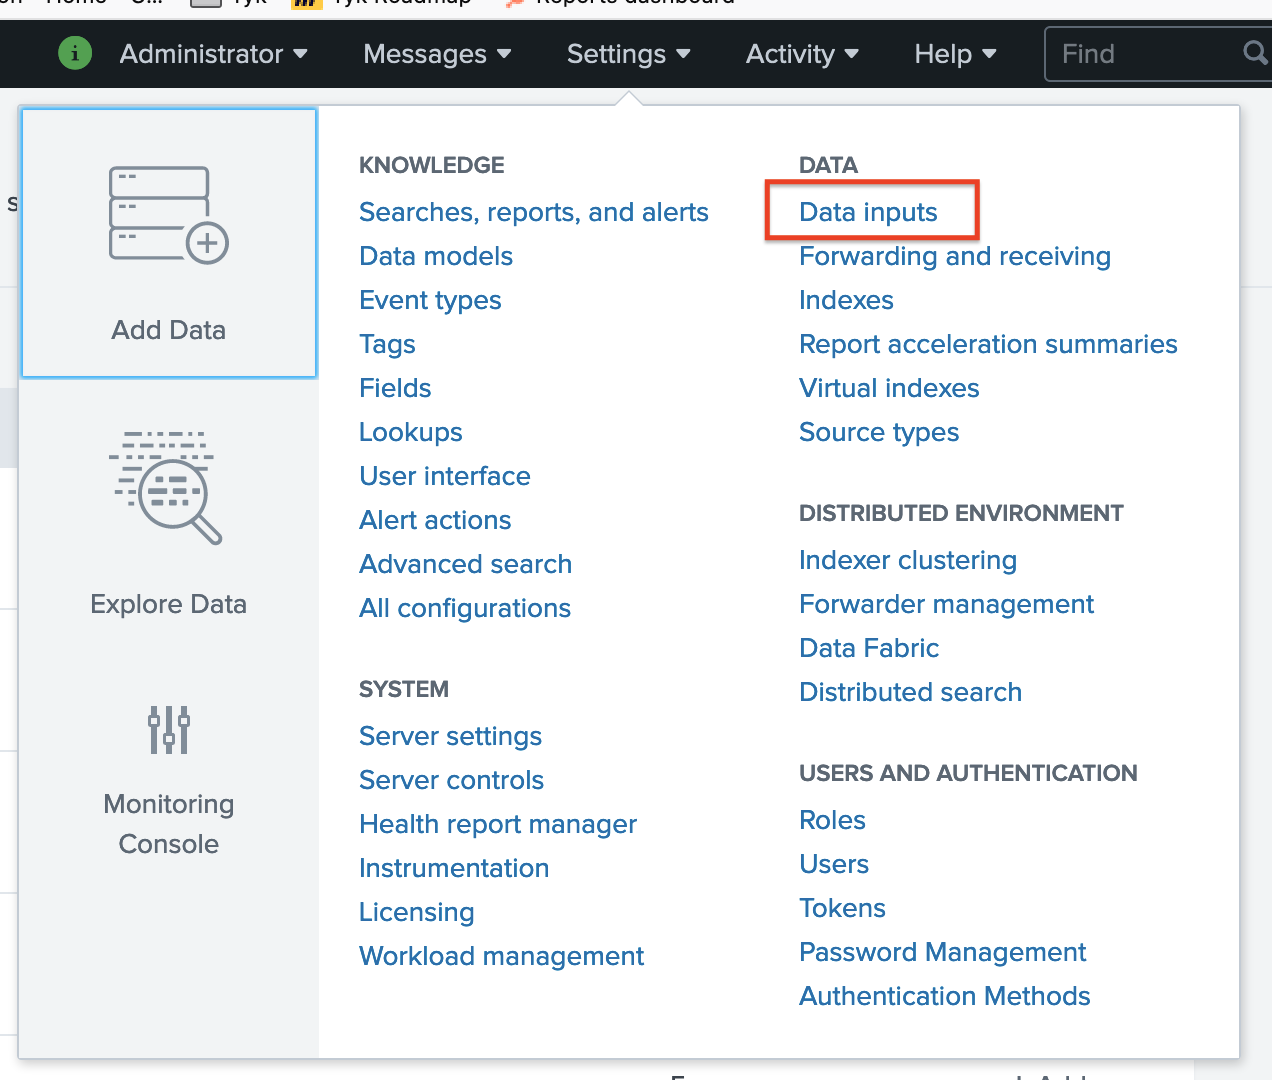 C) Select
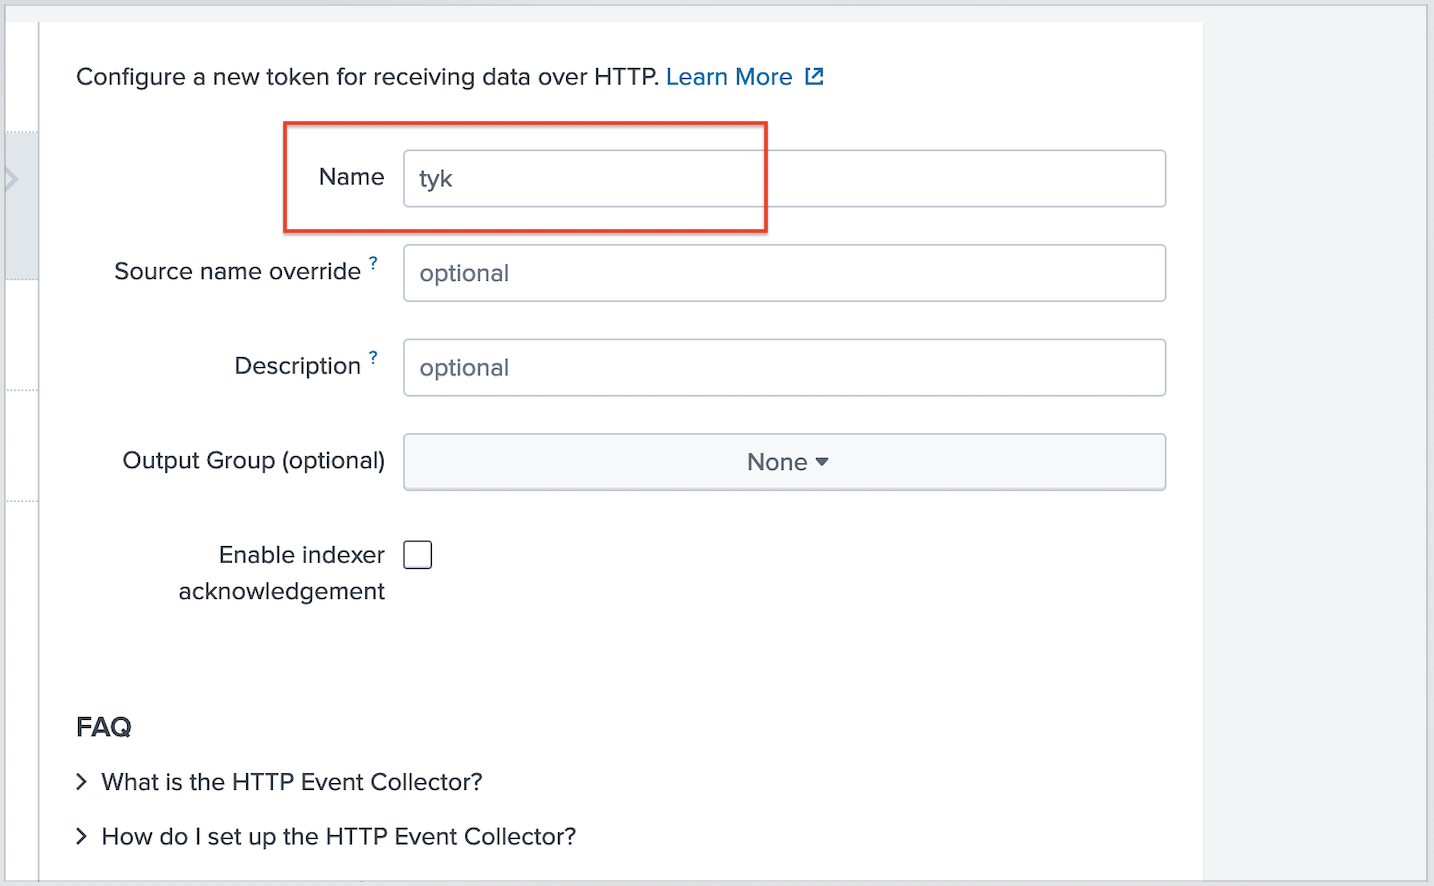
 HTTP Event Collector -> Add New D) Set the name to “tyk” and then leave everything else as default
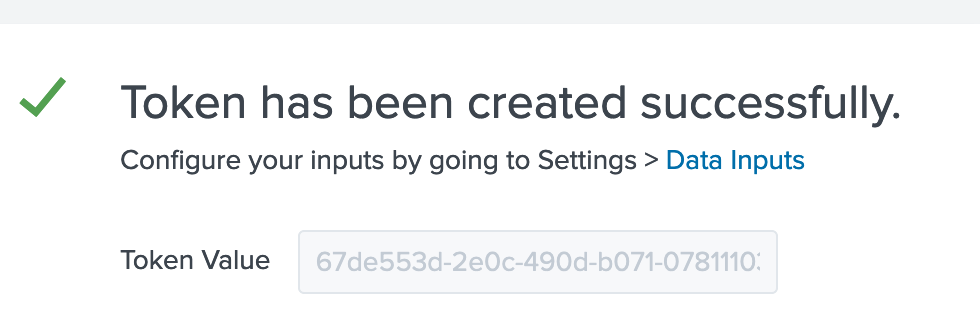
 Grab your token at the end page:
-
Add the Splunk bit to pump.conf
Edit your pump’s
pump.confand add this bit to the “Pumps” section, like so, adding the token from step #1: Make sure to add your token from the previous step into thecollector_tokenfield above
Make sure that the
localhost value matches with your setup. Head on over to our community forum to ask for help if you are stuck here.-
Restart Tyk Pump to pickup the Splunk config
If you are running Tyk Pump in Docker:
$ docker restart tyk-pump -
PROFIT!
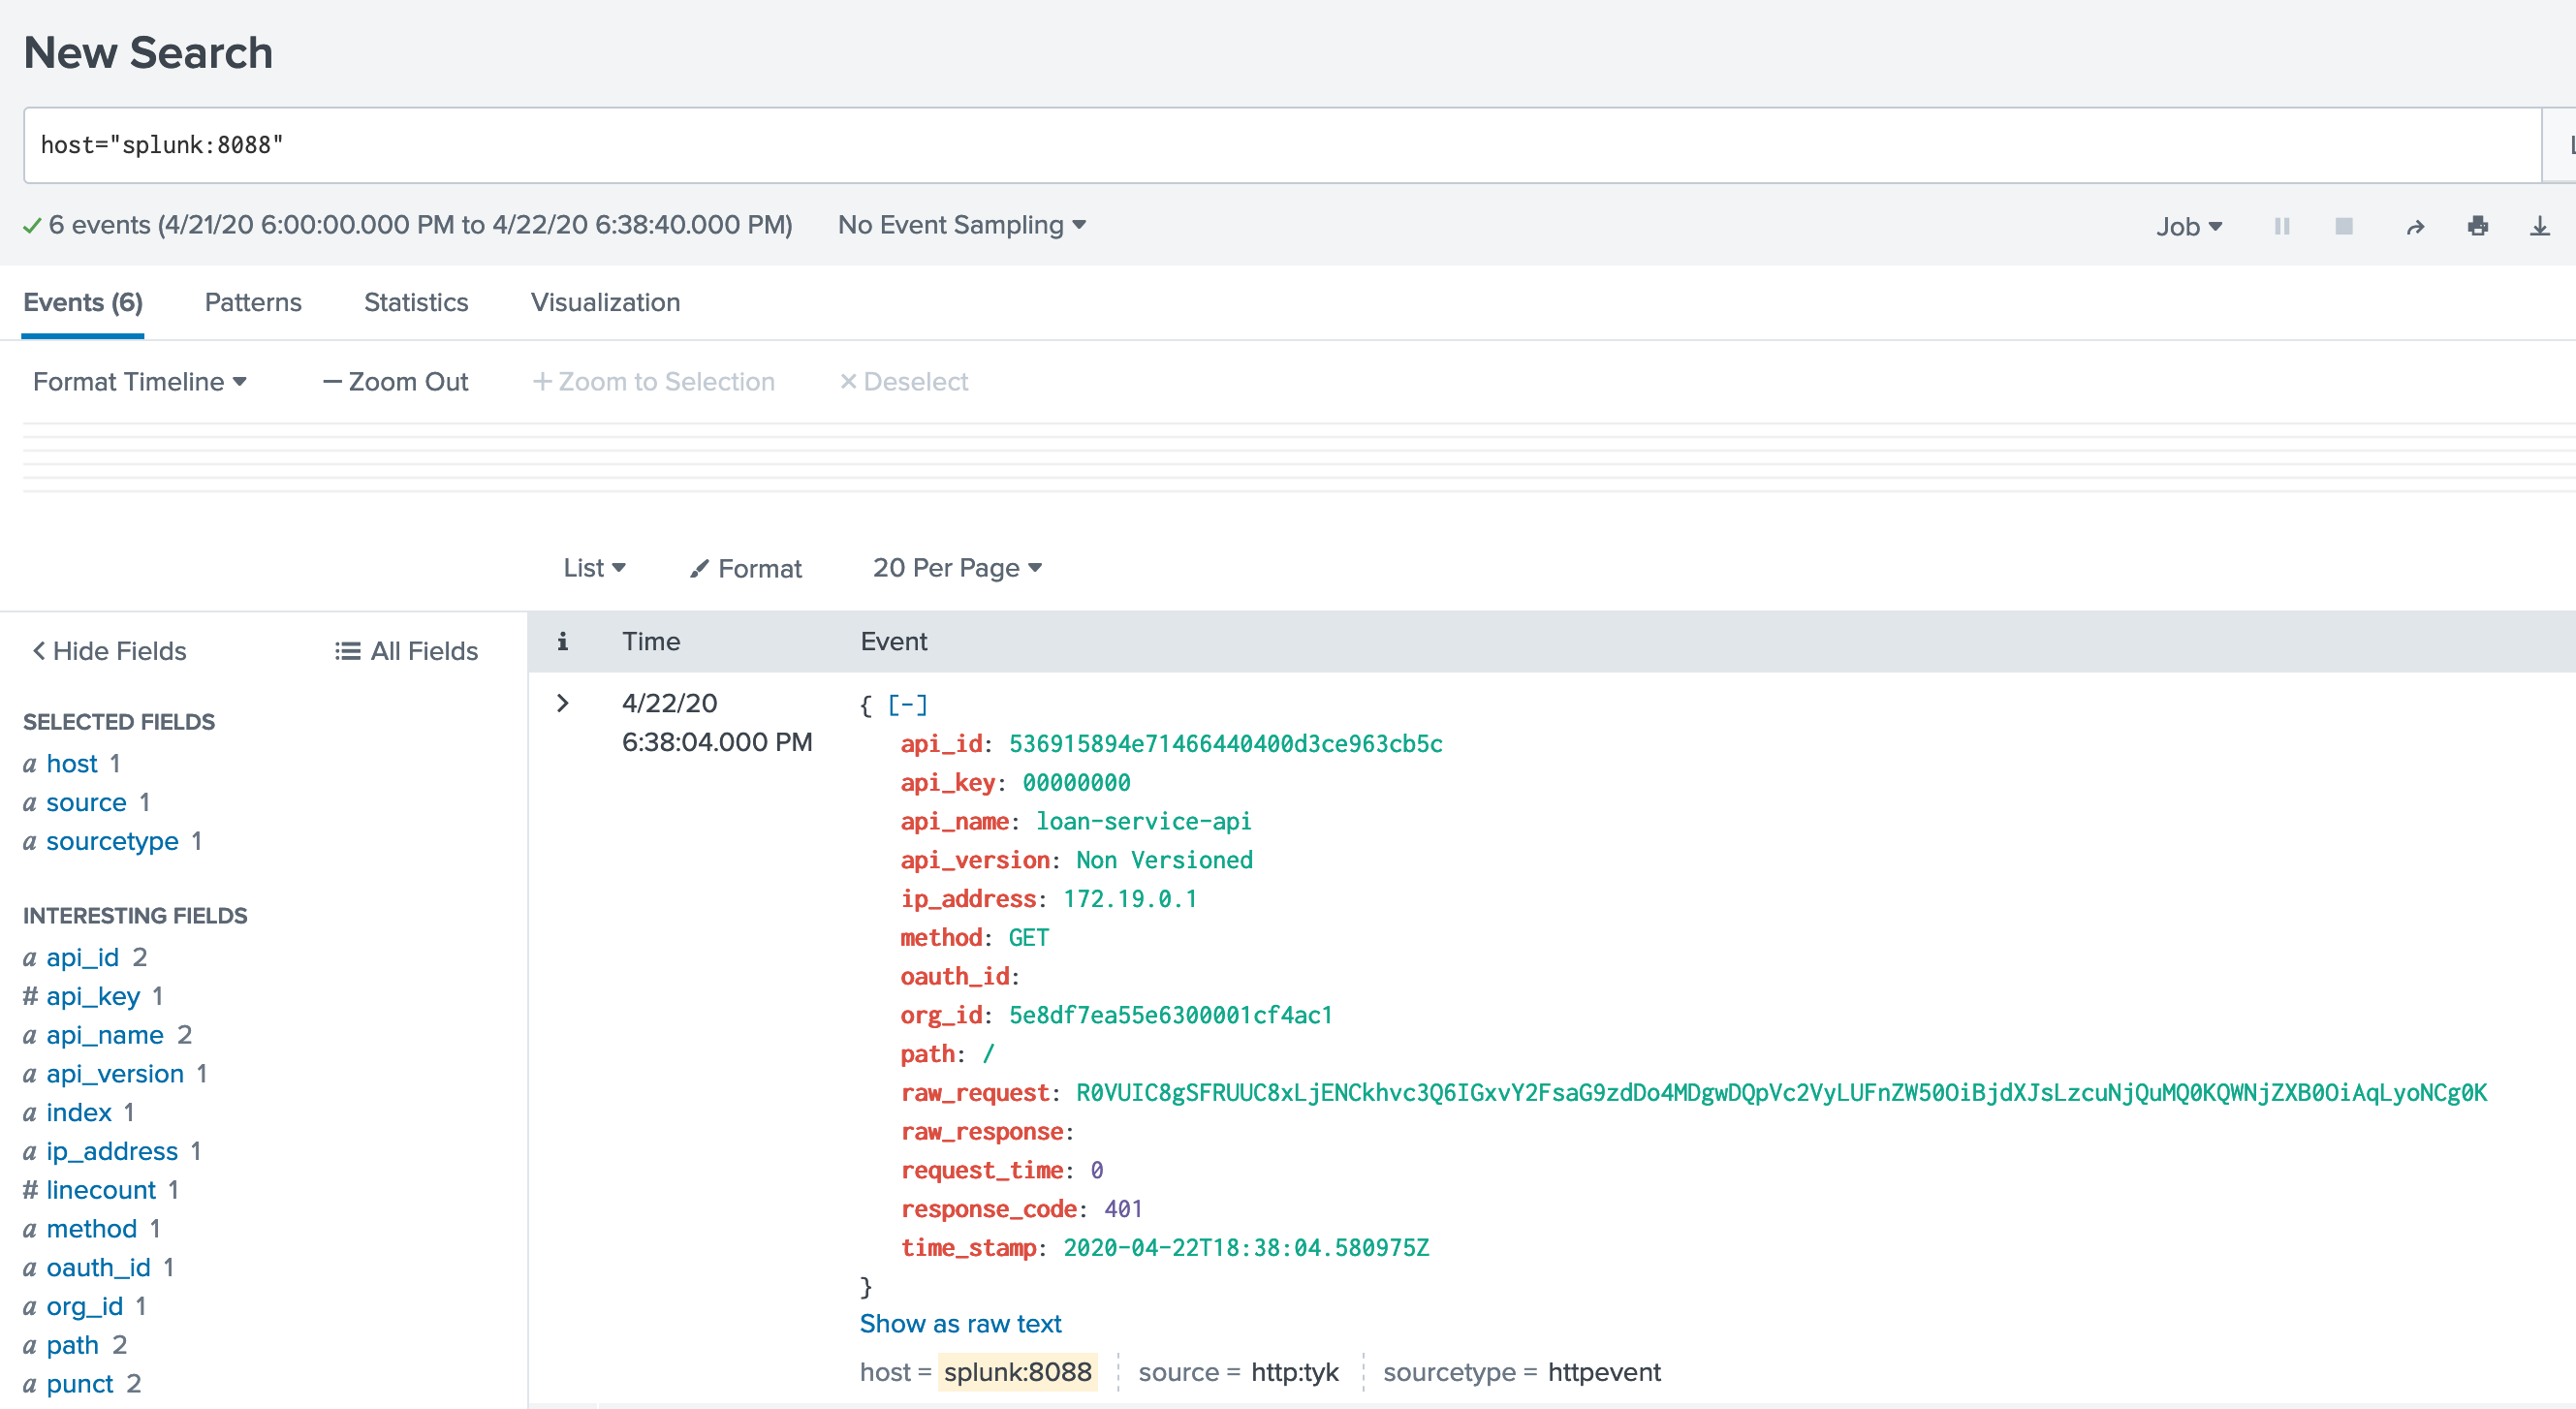
Let’s make a few API calls against Tyk, and see if they flow into Splunk
Success:
Logzio
Logz.io is a cloud-based log management and analytics platform that provides log management built on Elasticsearch, Logstash and Kibana.JSON / Conf file
Add the following configuration fields to the pumps section within yourpump.conf file:
Environment variables
<tyk-pump> with your host name or IP address.
Docker
Docker
-
Install Tyk Pump with PodMonitor
If you have Prometheus Operator enabled on the cluster, it would look for “PodMonitor” or “ServiceMonitor” resources and scrap from specified port. The only thing you would need to modify here is the helm release name for Prometheus Operator.
Also you can customize Prometheus Custom Metrics based on your analytics needs. We are using
tyk_http_requests_totalandtyk_http_latencydescribed here for illustration:
Please make sure you are installing Redis versions that are supported by Tyk. Please refer to Tyk docs to get list of supported versions.
For Custom Metrics, commas are escaped to be used in helm —set command. You can remove the backslashes in front of the commas if you are to set it in values.yaml. We have included an example in the default values.yaml comments section.
-
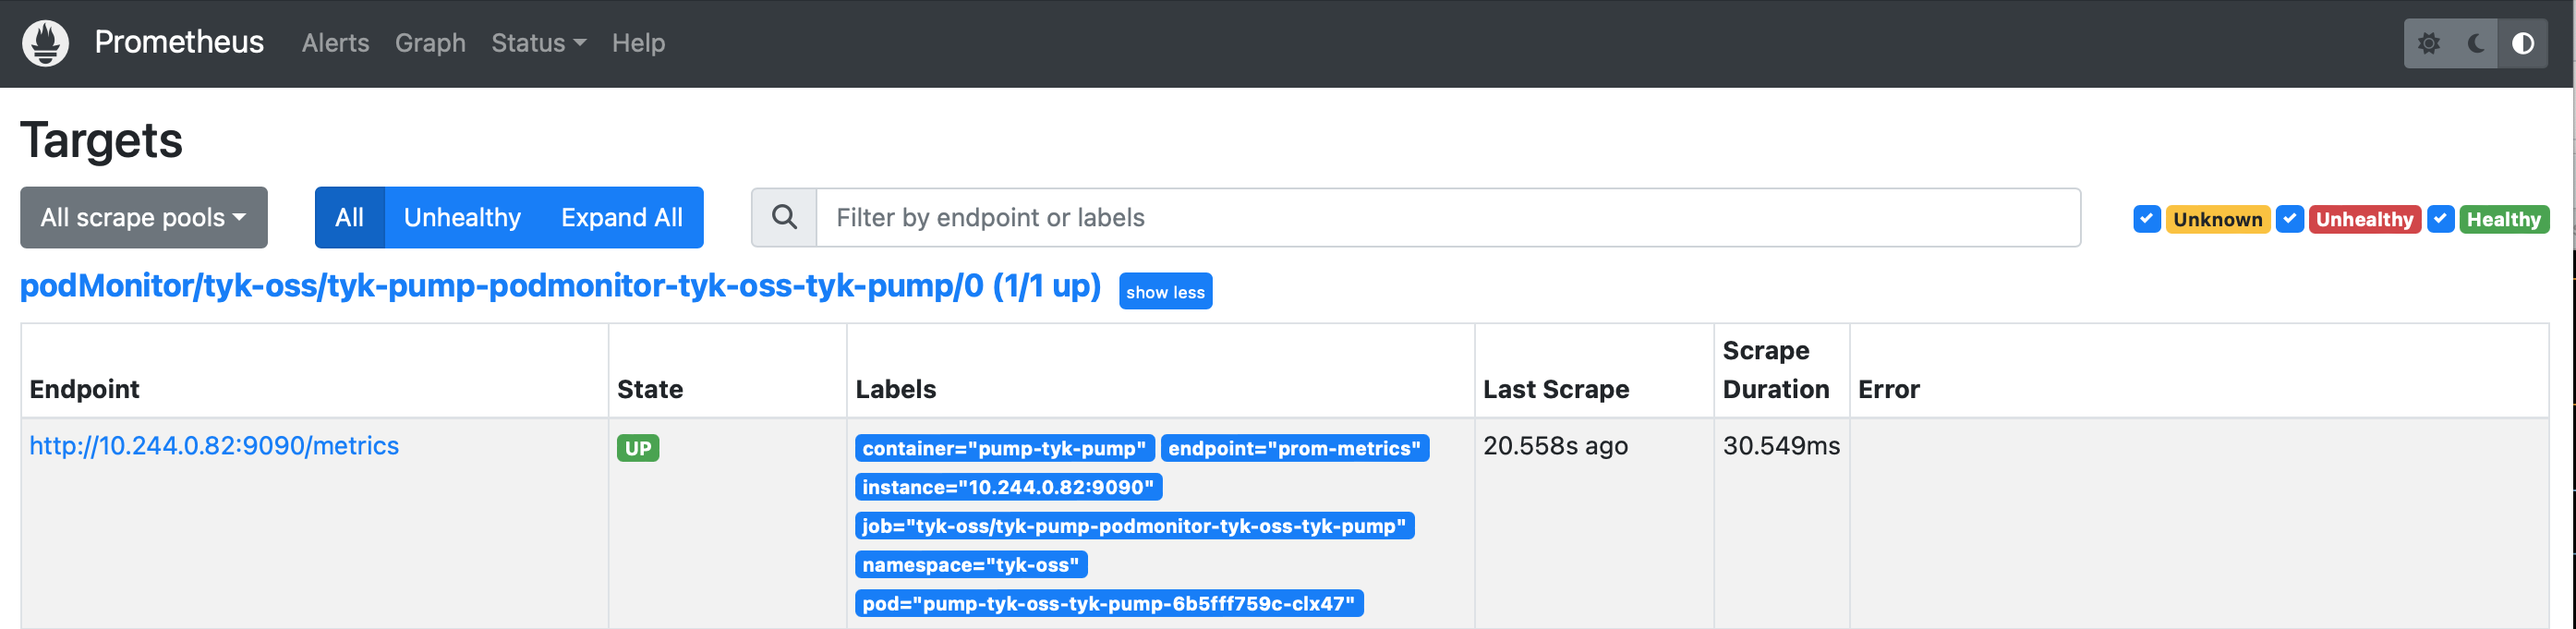
Verification
When successfully configured, you could see the following messages in pump log:
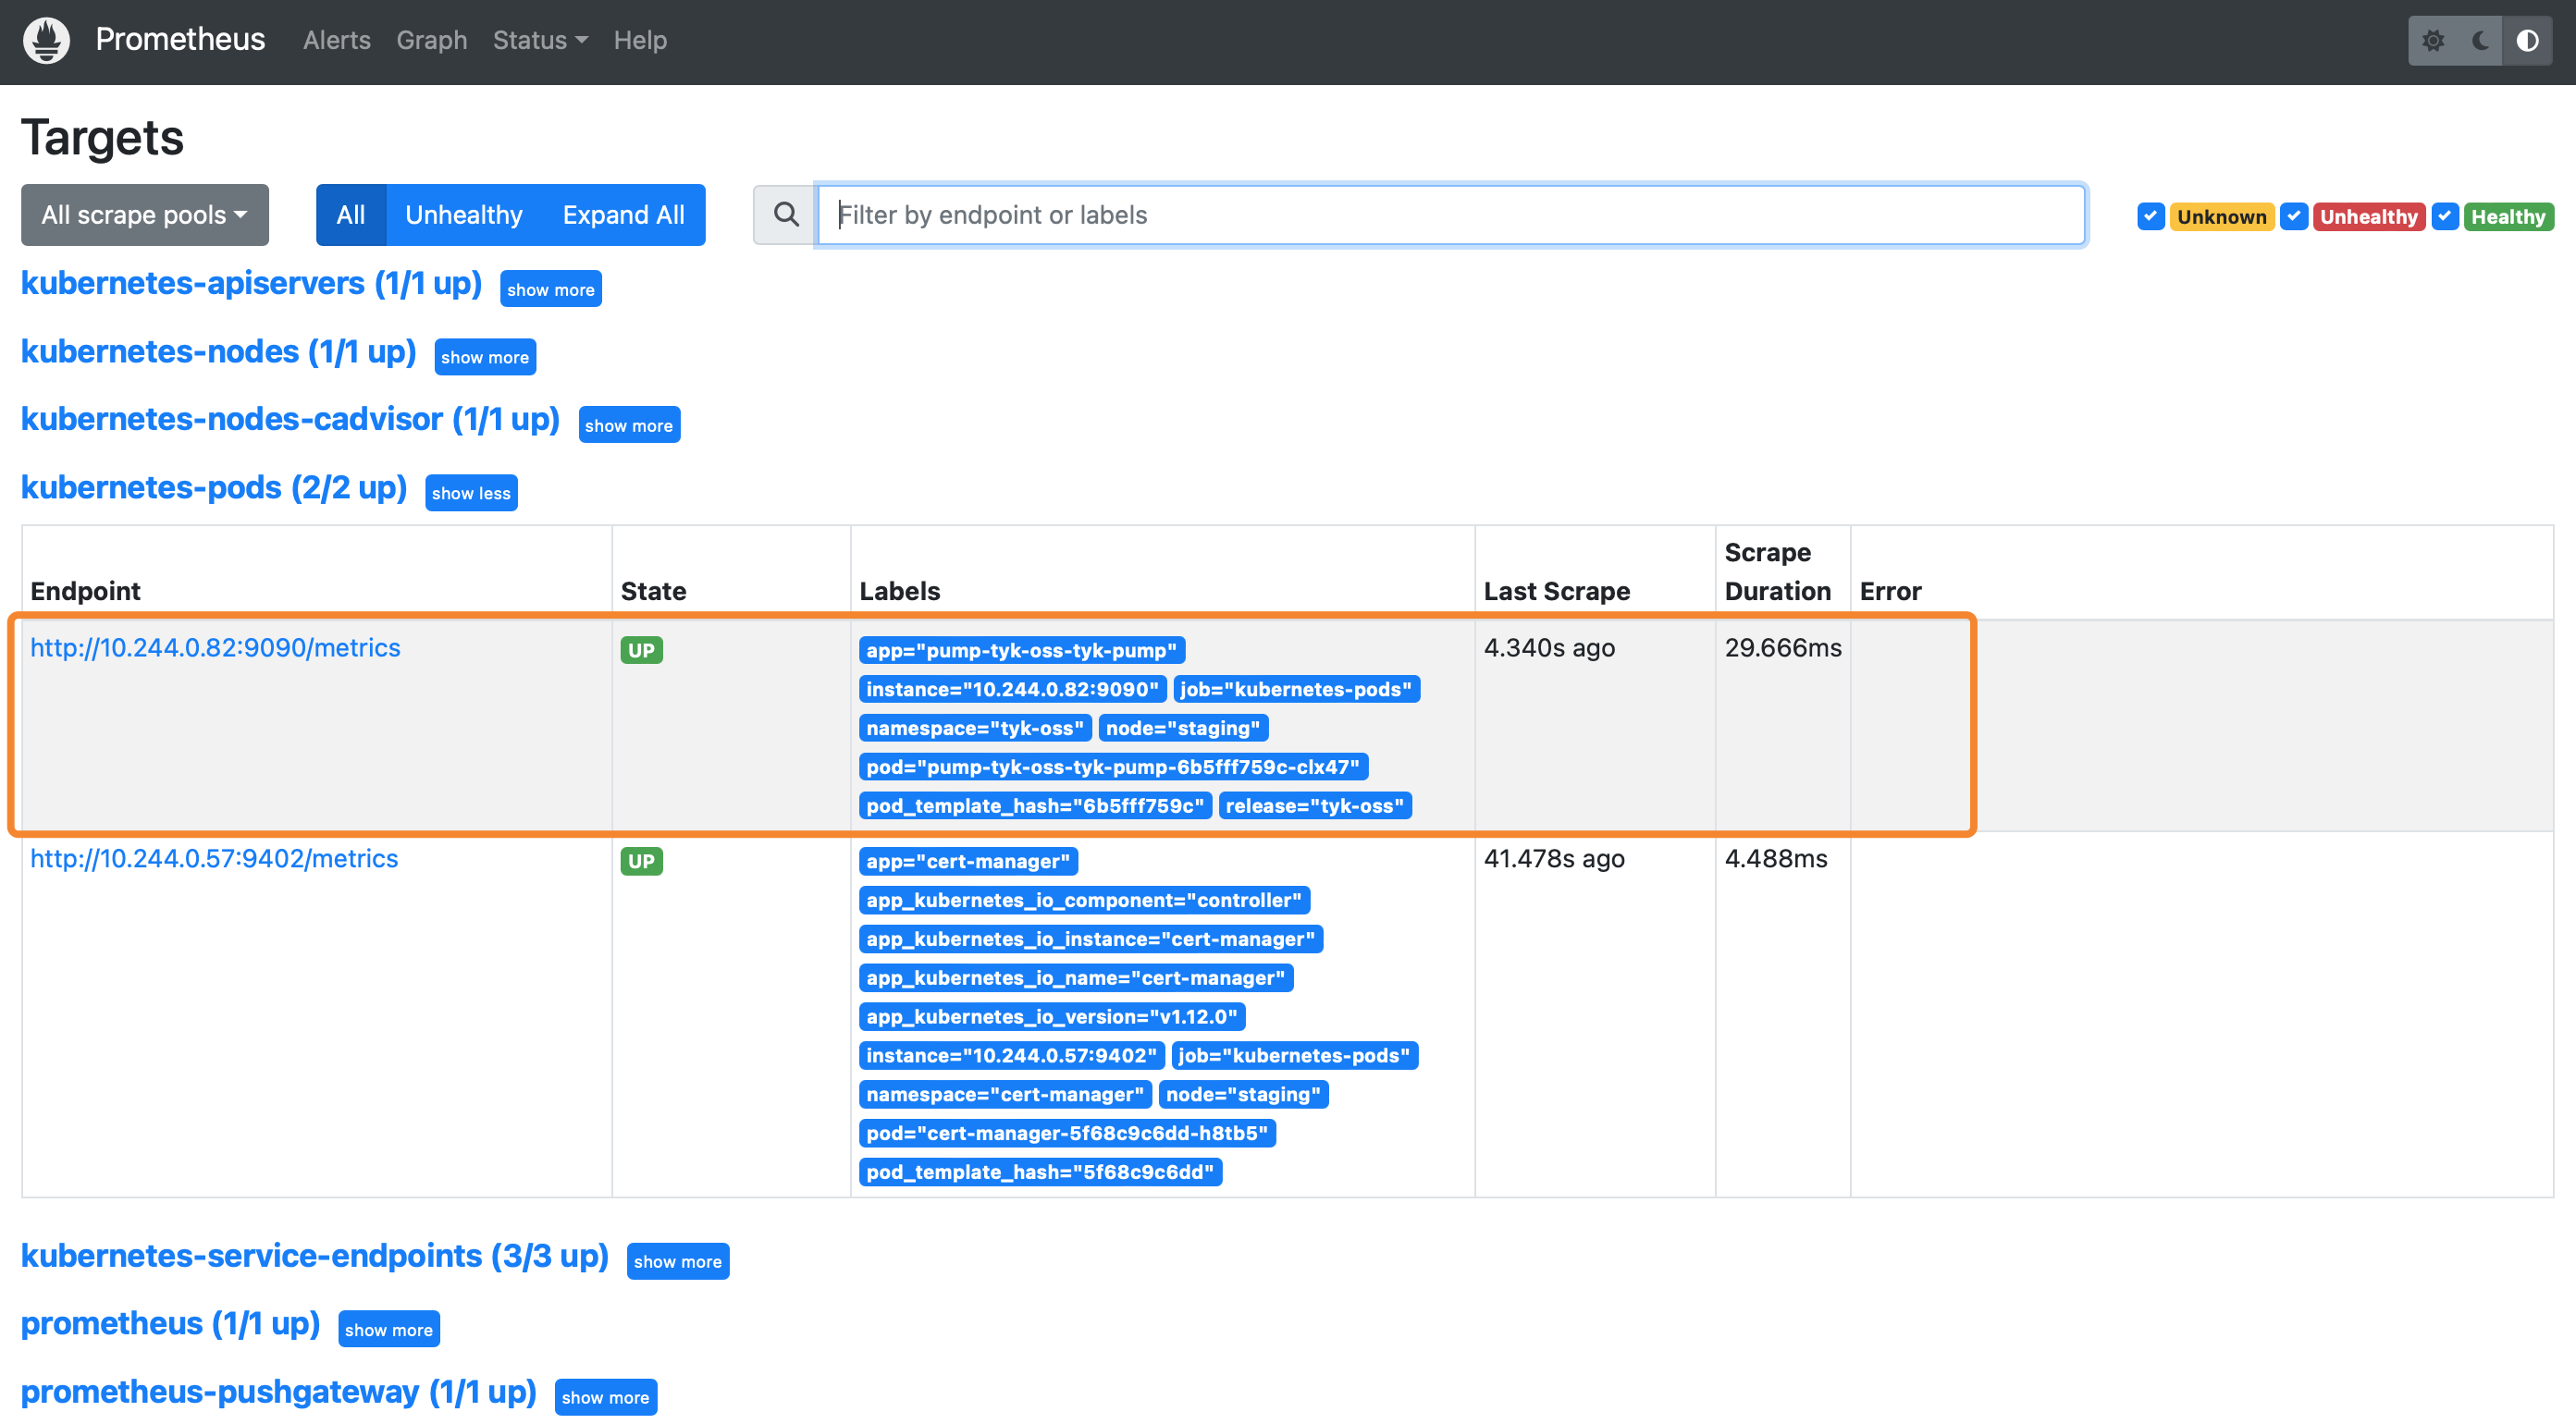
On Prometheus Dashboard, you can see the Pump is listed as one of the target and Prometheus is successfully scrapped from it.
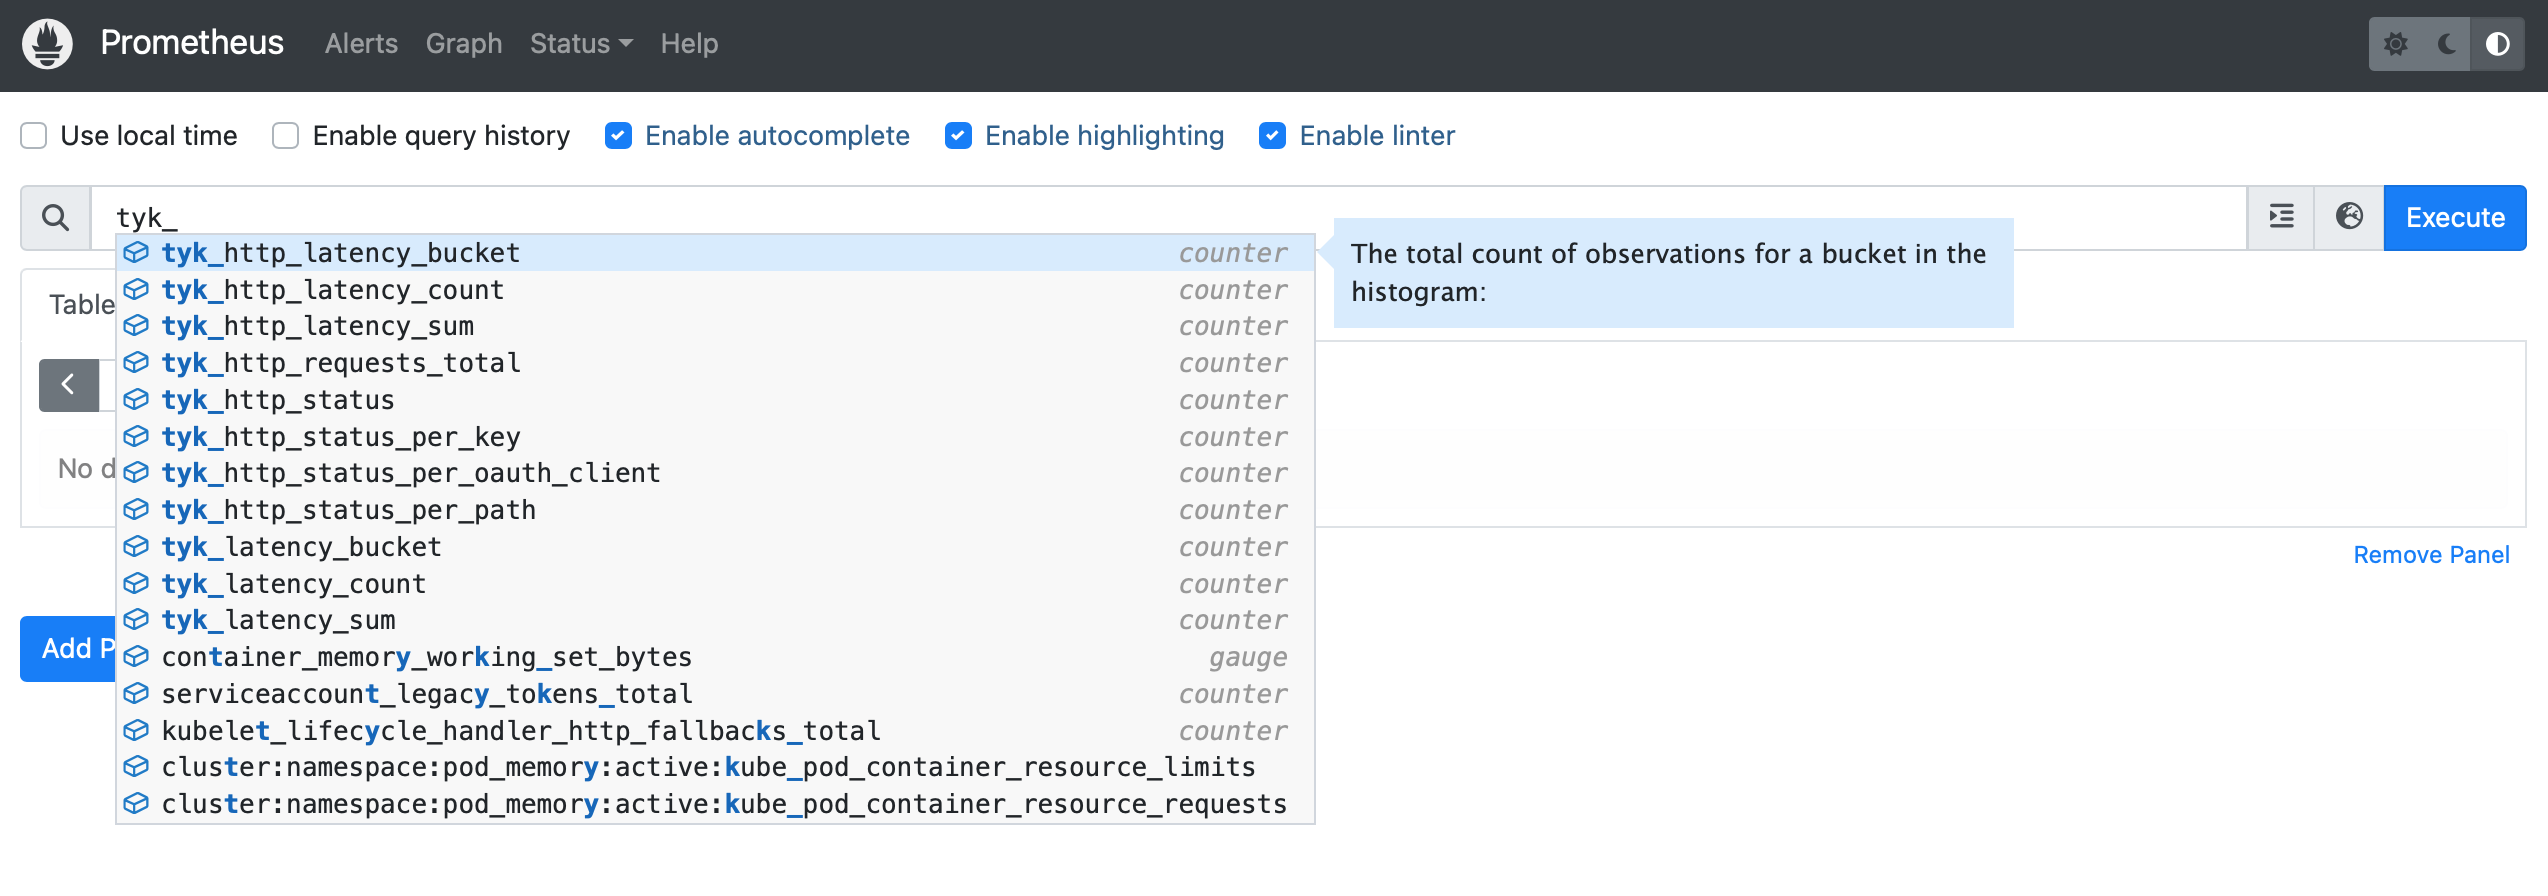
 You can check our Guide on Monitoring API with Prometheus for a list of useful queries you can setup and use.
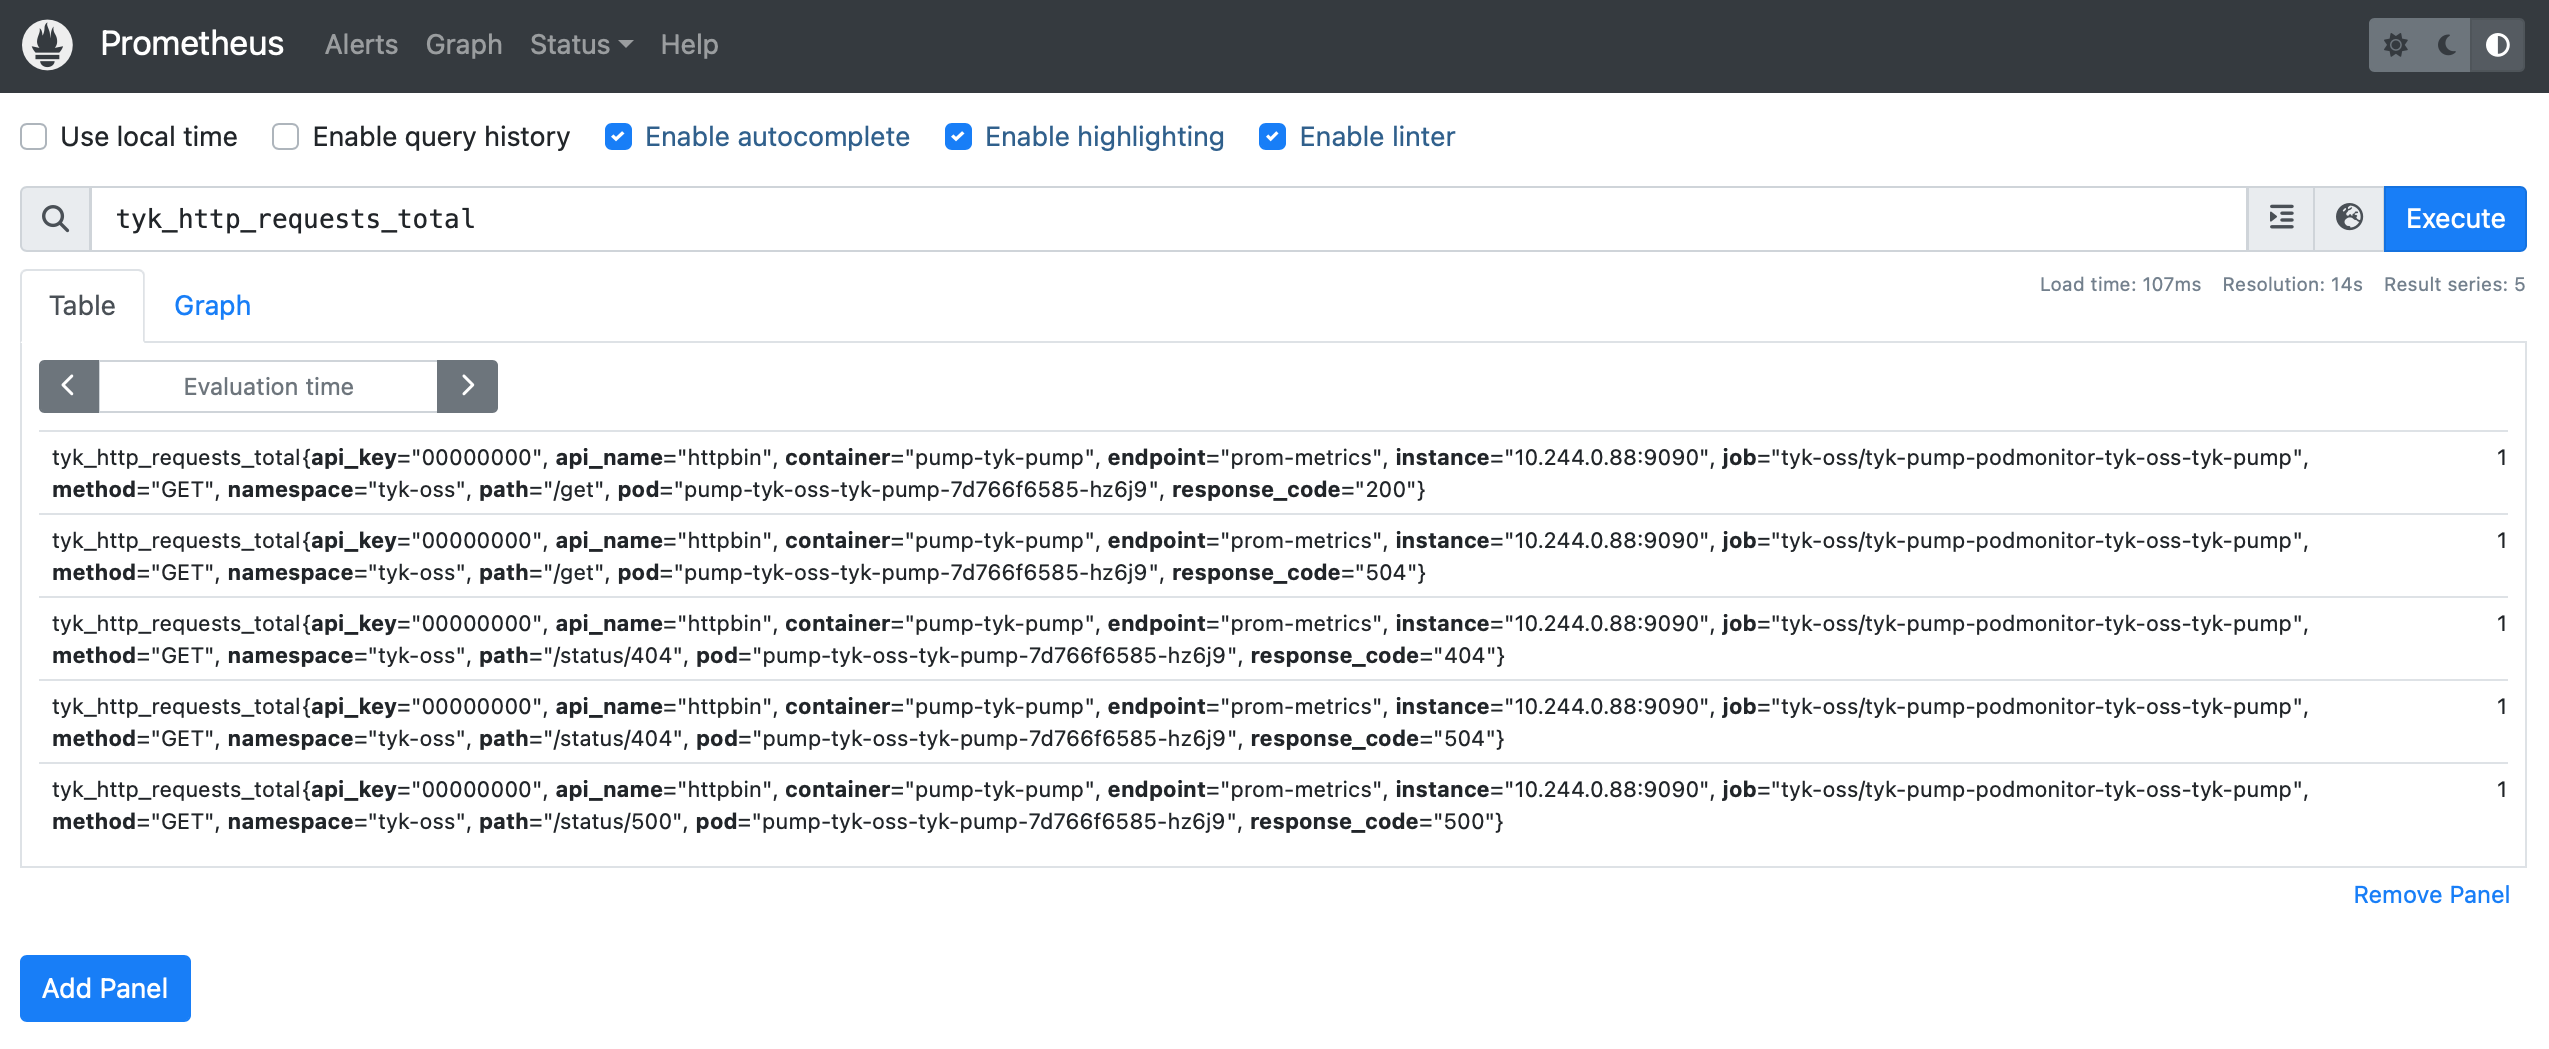
e.g. The custom metrics tyk_http_requests_total can be retrieved:
You can check our Guide on Monitoring API with Prometheus for a list of useful queries you can setup and use.
e.g. The custom metrics tyk_http_requests_total can be retrieved:
Integrate with Prometheus using annotations
Steps for Configuration:-
Setup Prometheus
Using the prometheus-community/prometheus chart
Alternatively, if you are not using Prometheus Operator, please check how your Prometheus can support service discovery. Let say you’re using the prometheus-community/prometheus chart, which configures Prometheus to scrape from any Pods with following annotations:
To install Prometheus, run
-
Install Tyk Pump with prometheus annotations
Please make sure you are installing Redis versions that are supported by Tyk. Please refer to Tyk docs to get list of supported versions.
-
Verification
After some time, you can see that Prometheus is successfully scraping from Tyk Pump:
Expose a service for Prometheus to scrape
You can expose Pump as a service so that Prometheus can access the/metrics endpoint for scraping. Just enable service in tyk-pump.pump.service:
timestamp field is older then specified expiration time.
Time Based Cap in multi-tenant environments
When you have multiple organizations, you can control analytics expiration on per organization basis. This technique also use TTL indexes, as described above, but index should look like:expireAt to correspond to the time the document should expire. MongoDB will automatically delete documents from the tyk_analytics collection 0 seconds after the expireAt time in the document. The expireAt will be calculated and created by Tyk in the following step.
Create an Organization Quota
Adding the Size Cap if using a mongo_selective Pump
Themongo_selective pump stores data on a per organization basis. You will have to run the following command in your MongoDB shell for an individual organization as follows.
Separated Analytics Storage
For high-traffic systems that make heavy use of analytics, it makes sense to separate out the Redis analytics server from the Redis configuration server that supplies auth tokens and handles rate limiting configuration. To enable a separate analytics server, update yourtyk.conf with the following section:
addrs is new in v2.9.3, and replaces hosts which is now deprecated.enable_cluster to false, you only need to set one entry in addrs:
The configuration is the same (and uses the same underlying driver) as the regular configuration, so Redis Cluster is fully supported.